
自动割草机与田地面积的线性函数模型示例
几何画板及绘图内容加载中,请稍等……
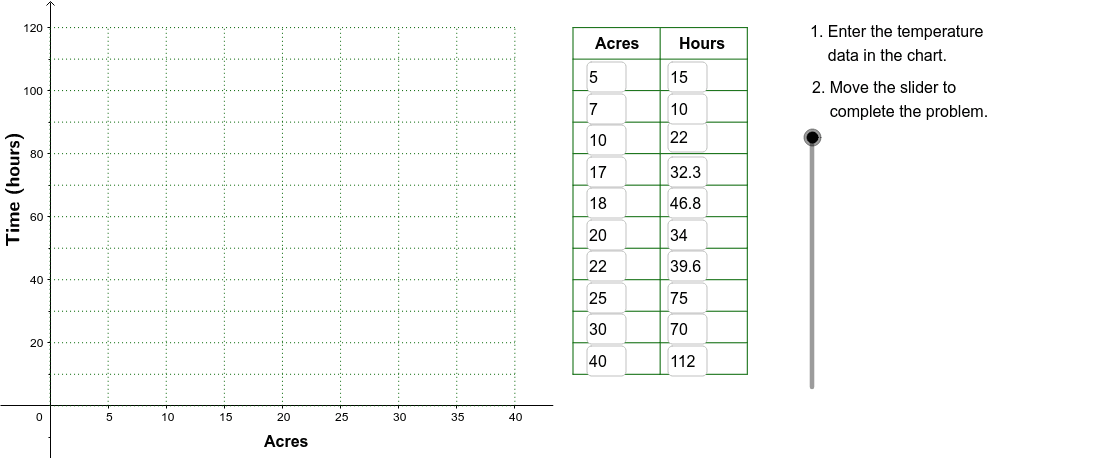
本范例演示了利用自动割草机作业时间与不同田地面积之间的线性关系,通过散点图与拟合直线展示现实建模现象。核心数学概念包括线性函数、函数图像、散点图、置信区间、自然数、比例运算以及平行四边形面积等。作图要点提炼自构造摘要:使用 Corner 命令生成田地顶点,Polygon 命令构建多边形田地,Line 命令绘制拟合直线,Sequence 命令批量生成数据点,Textfield 与 VerticalText 用于标注说明,Slid 滑块对象用于动态调整参数,并涉及 poly1 及 corn1–corn4 等多边形与顶点对象,A1–B9 等点对象用于散点数据。适合初中至高中阶段的函数与统计教学,也可用于教师课堂演示与学生自主探究线性回归建模。
GeoGebra 命令及参数
Corner(2) → Corn2Corner(3) → Corn3Polygon(Corn1, Corn2, Corn3, Corn4) → poly1, corn1, corn2, corn3, corn4Textfield(A2) → InA2Textfield(A3) → InA3Textfield(A4) → InA4Textfield(A5) → InA5Textfield(A6) → InA6Textfield(A7) → InA7Textfield(A8) → InA8Textfield(A9) → InA9Textfield(B9) → InB9Textfield(B8) → InB8Textfield(B7) → InB7Textfield(B6) → InB6Textfield(B5) → InB5Textfield(B4) → InB4Textfield(B3) → InB3Textfield(B2) → InB2Line(Pt1, Pt2) → FitLineSequence(Segment[(45, 10 + (10 * j)), (60, 10 + (10 * j))], j, 0, 11) → LnListSequence(Segment[(45 + (7.5 * j), 10), (45 + (7.5 * j), 120)], j, 0, 2) → LnList2Textfield(A10) → InA10Textfield(A11) → InA11Textfield(B10) → InB10Textfield(B11) → InB11VerticalText("\text{Time (hours)}") → DownLegendSequence(Segment[((5 * i), 0), ((5 * i), 120)], i, 0, 8) → GridxSequence(Segment[(0, (10 * i)), (40, (10 * i))], i, 0, 12) → Gridy
AI 绘图提示语参考
绘制一个表示田地的平行四边形,用四个顶点标注面积;绘制一系列散点表示 mowing 时间与田地面积的关系;绘制一条拟合线;添加坐标轴网格线,并标注垂直轴为“时间(小时)”,加入调节线性模型斜率和截距的滑块。
以上提示语为根据原始绘图命令整理而来,仅供参考。