
改变斜率对线性关系的影响
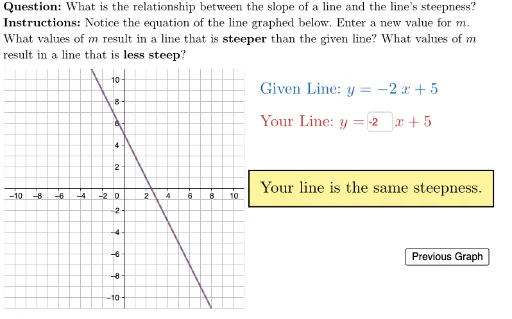
几何画板及绘图内容加载中,请稍等……
本范例演示改变斜率如何影响线性关系。核心数学概念包括线性方程。通过使用GeoGebra命令如If, Textfield, Polygon等,用户可以动态调整斜率并观察线性关系的变化。适合初中及以上学生学习线性方程和几何作图。
GeoGebra 命令及参数
If(isPart1, 3, -2) → givenMIf(¬isPart1, 5, 7) → givenBTextfield(textUserM) → ansBoxUserMLaTeX(("\text{Given Line: }y=" * givenLine)) → givenLineLabelIf(abs(numUserM) > abs(givenM), "steeper", If[abs(numUserM) < abs(givenM), "less steep", If[abs(numUserM) ≟ abs(givenM), "the same steepness", "invalid"]]) → resultLaTeX((("\fcolorbox{black}{#fff59d}{\text{Your line is " * result) * ".}}")) → feedbackLaTeX(("\text{Your Line: }y=\hspace{40}x+" * givenB)) → userLineLabelPolygon((-11, -11), (-11, 11), (11, 11), (11, -11)) → viewBox, f, g, h, iLaTeX("\text{\textbf{Question: }What is the relationship between the slope of a line and the line's steepness?\\\textbf{Instructions: }Notice the equation of the line graphed below. Enter a new value for \(m\).\\What values of \(m\) result in a line that is \textbf{steeper} than the given line? What values of \(m\)\\result in a line that is \textbf{less steep}?}") → TEXT
AI 绘图提示语参考
画一个演示线性关系如何受斜率影响的图形。显示两条直线,一条为给定直线,另一条为用户输入斜率的直线。标注两条直线的方程,并比较它们的陡峭程度,用颜色框提示用户输入的斜率与给定直线的陡峭关系。背景为一个矩形坐标系,上方有文字说明问题与操作指引。
以上提示语为根据原始绘图命令整理而来,仅供参考。