
从表格值绘制线性关系
几何画板及绘图内容加载中,请稍等……
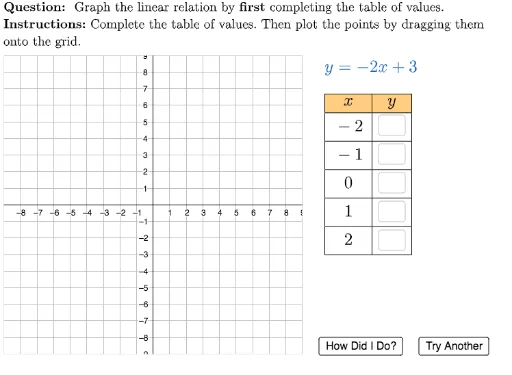
本范例演示如何使用表格值绘制直线。核心数学概念包括线性方程。作图要点包括使用GeoGebra命令Sequence、Polygon、Element、Zip等。适合初中及以上学生学习线性关系的绘制方法。
GeoGebra 命令及参数
Sequence((i, -4.8), i, 14.5, 18.5, 1) → homeBasePointsPolygon((-9, -9), (-9, 9), (9, 9), (9, -9)) → viewBox, f, g, h, iElement(questionList, questionListIndex) → questionNumElement(C2:C5, questionNum) → currentXValuesElement(B2:B5, questionNum) → currentYInterceptElement(A2:A11, questionNum) → currentSlopeZip(dottedCorrectLine(A), A, currentXValues) → currentYValuesZip(A ≟ B, A, usersPreTaskValues, B, currentYValues) → arePreTasksCorrectUnicodeToLetter(10007) → xmarkUnicodeToLetter(10003) → cmarkDynamicCoordinates(freeA, If[IsInRegion[freeA, viewBox], x(freeA), x(Element[homeBasePoints, 1])], If[IsInRegion[freeA, viewBox], y(freeA), y(Element[homeBasePoints, 1])]) → ADynamicCoordinates(freeB, If[IsInRegion[freeB, viewBox], x(freeB), x(Element[homeBasePoints, 2])], If[IsInRegion[freeB, viewBox], y(freeB), y(Element[homeBasePoints, 2])]) → BDynamicCoordinates(freeC, If[IsInRegion[freeC, viewBox], x(freeC), x(Element[homeBasePoints, 3])], If[IsInRegion[freeC, viewBox], y(freeC), y(Element[homeBasePoints, 3])]) → CDynamicCoordinates(freeD, If[IsInRegion[freeD, viewBox], x(freeD), x(Element[homeBasePoints, 4])], If[IsInRegion[freeD, viewBox], y(freeD), y(Element[homeBasePoints, 4])]) → DDynamicCoordinates(freeE, If[IsInRegion[freeE, viewBox], x(freeE), x(Element[homeBasePoints, 5])], If[IsInRegion[freeE, viewBox], y(freeE), y(Element[homeBasePoints, 5])]) → EZip((A, B), A, currentXValues, B, currentYValues) → correctPointsLaTeX("\text{Points:}") → pointsLabelLaTeX("\text{Please plot all points.}") → feedbackPlotAllPointsSequence(i, i, -8, 8, 4) → C3Sequence(i, i, -4, 4, 2) → C5FitPoly(usersPoints, 1) → usersLineLaTeX(Element[D2:D5, questionNum]) → displayEquationZip("\vphantom{\tfrac{1}{2}}" + (A), A, currentXValues) → sizedXValuesTableText({Join[{{"\cellcolor{#ffcc80}{x}"}, sizedXValues}], Join[{{"\cellcolor{#ffcc80}{y}"}, currentYValues}]}, "|_vc") → preTaskLabelTextfield(textPreTask1) → ansBoxPreTask1Textfield(textPreTask2) → ansBoxPreTask2Textfield(textPreTask3) → ansBoxPreTask3Textfield(textPreTask4) → ansBoxPreTask4Textfield(textPreTask5) → ansBoxPreTask5LaTeX("\text{Substitute the values of \(x\) into\\\(" + displayEquation + "\) and solve for the\\corresponding \(y\) values.}") → feedbackPreTaskZip("\vphantom{\tfrac{\tfrac{1}{2}}{3}}" + (If[¬A, ("y=" * B), ""]), A, arePreTasksCorrect, B, currentYValues) → hintsTableText({hints}, "v") → preTaskLabelHintLaTeX("\text{\textbf{Question: } Graph the linear relation by \textbf{first} completing the table of values.\\\textbf{Instructions: }Complete the table of values. Then plot the points by dragging them\\onto the grid.}") → TEXT