
GeoGebra方程与函数交互演示
几何画板及绘图内容加载中,请稍等……
①本范例通过交互式图形演示线性方程与不等式的几何表示及变换;②涉及核心数学概念包括线性函数、几何变换、标准差、概率树图、集合论;③构造要点运用了LaTeX、PolyLine、Intersect、Segment、TableText等GeoGebra命令与对象,实现动态数据生成与条件作图;④适合高中数学教学,用于函数图像绘制、数据统计分析及几何变换的可视化教学。
GeoGebra 命令及参数
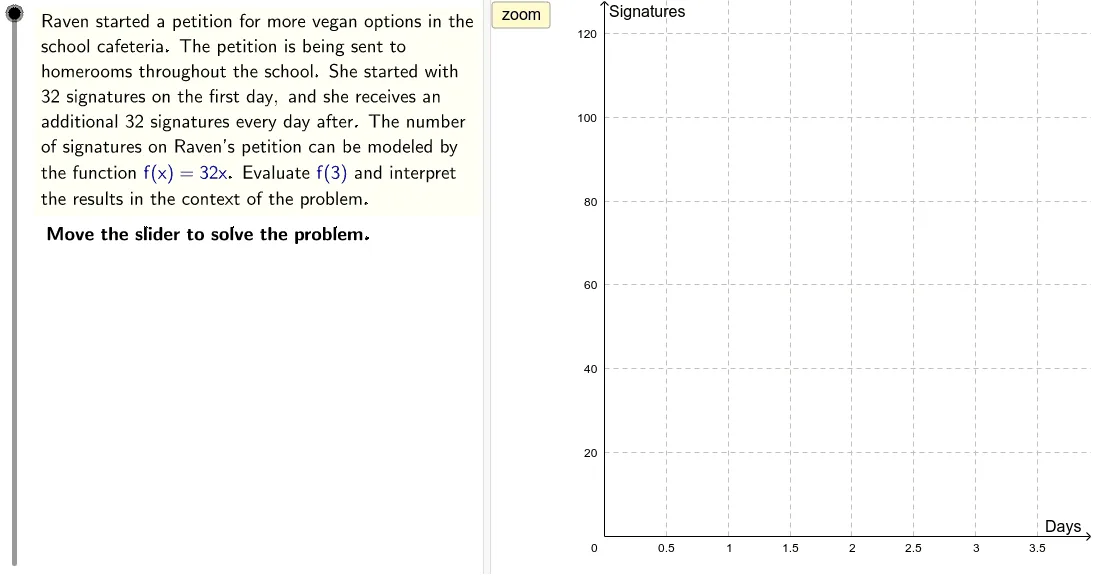
LaTeX(steps) → counterLaTeX("\text{Move the slider to solve the problem.}") → text0LaTeX("\text{Use the buttons below to return to the original}\cr\text{problem or randomly generate a similar practice}\cr\text{problem.}") → RandomizationTextCorner(2, 3) → toprightCorner(2, 1) → bottomleftLaTeX((((((((("\text{Raven started a petition for more vegan options in the}\cr\text{school cafeteria. The petition is being sent to}\cr\text{homerooms throughout the school. She started with}\cr\text{}" * sigs) * "\text{ signatures on the first day, and she receives an}\cr\text{additional }") * sigs) * "\text{ signatures every day after. The number}\cr\text{of signatures on Raven’s petition can be modeled by}\cr\text{the function }\textcolor{#000099}{f(x) = ") * sigs) * "x}\text{. Evaluate }\textcolor{#000099}{f(") * evalAt) * ")}\text{ and interpret}\cr\text{the results in the context of the problem.}")) → ProblemLaTeX("\text{Evaluate the function.}") → text1LaTeX("\text{Interpret the results.}") → text6LaTeX((((((("\text{This is a point, }\textcolor{#000099}{(" * evalAt) * ", ") * evaled) * ")}\text{, on the graph of the}\cr\text{function }\textcolor{#0099}{f(x) = ") * sigs) * "x}\text{.}")) → text8Corner(2, 2) → bottomrightCorner(2, 4) → topleftPolyLine(bottomleft, bottomright, topright, topleft, bottomleft) → frameIntersect(f, frame) → A, BIf(x(A) ≥ x(B), Vector[(0, 0), A], Vector[(0, 0), B]) → uSegment(Mark, (0, evaled)) → gLaTeX((((("\text{At the end of day }\textcolor{#000099}{" * evalAt) * "}\text{, the petition has }\textcolor{#000099}{") * evaled) * "}\cr\text{ signatures.}")) → text7TableText({{LaTeX[(("\textcolor{#000099}{f(x)=" * f) * "}")], LaTeX["\text{Original function}"]}, {LaTeX[(((((("\textcolor{#000099}{f(" * evalAt) * ")=") * sigs) * "(") * evalAt) * ")}")], LaTeX[(("\text{Substitute }\textcolor{#000099}{" * evalAt) * "}\text{ for }\textcolor{#000099}{x}\text{.}")]}}, "l") → text3TableText({{LaTeX[(("\textcolor{#000099}{f(x)=" * f) * "}")], LaTeX["\text{Original function}"]}, {LaTeX[(((((("\textcolor{#000099}{f(" * evalAt) * ")=") * sigs) * "(") * evalAt) * ")}")], LaTeX[(("\text{Substitute }\textcolor{#000099}{" * evalAt) * "}\text{ for }\textcolor{#000099}{x}\text{.}")]}, {LaTeX[(((("\textcolor{#000099}{f(" * evalAt) * ")=") * evaled) * "}")], LaTeX["\text{Multiply.}"]}}, "l") → text4TableText({{LaTeX[(("\textcolor{#000099}{f(x)=" * f) * "}")], LaTeX["\text{Original function}"]}}, "l") → text2