
垂直渐近线的极限定义
几何画板及绘图内容加载中,请稍等……
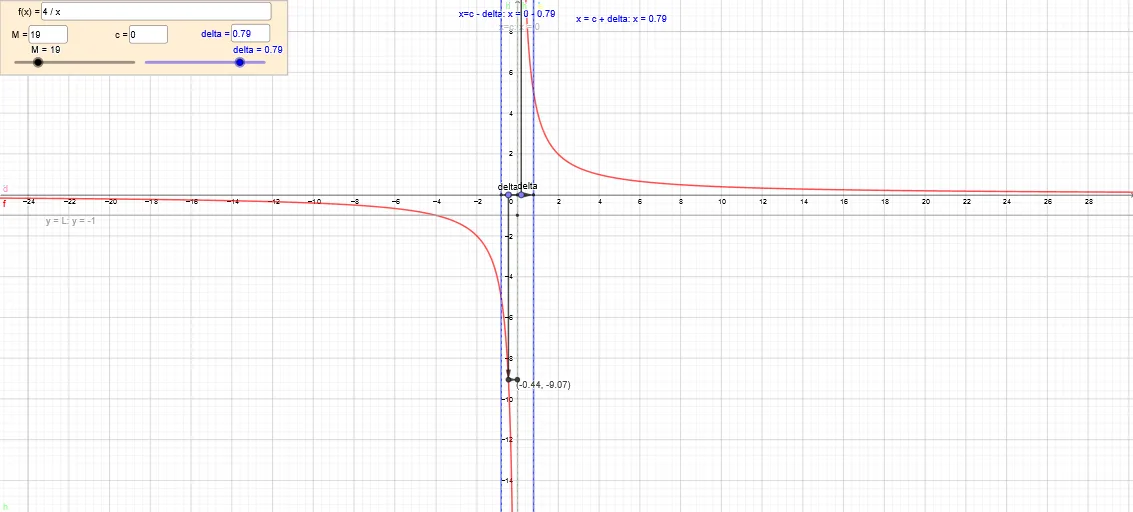
本范例演示了无限极限的正式定义,即垂直渐近线。通过构造函数f(x)在某点x0的极限,展示了当x趋近于x0时,函数值趋向于无穷大。使用了Vector, Segment, Point, Intersect等GeoGebra命令。适合高中数学教学,帮助学生理解极限概念。
GeoGebra 命令及参数
Textfield(f) → InputBox1Textfield(delta) → InputBox5Intersect(eq1, xAxis) → HIntersect(eq2, xAxis) → IIntersect(q, xAxis) → JVector(H, I) → wVector(H, J) → aSegment(I, J) → iTextfield(c) → InputBox2Point(a) → QOrthogonalLine(Q, xAxis) → mIntersect(f, m, (0.1897318290026606, 21.082387815614783)) → RIntersect(f, m, (0.1897318290026606, 21.082387815614783)) → SOrthogonalLine(R, yAxis) → rIntersect(r, yAxis) → TVector(Q, R) → sVector(R, T) → tPoint(w) → UOrthogonalLine(U, xAxis) → nIntersect(f, n, (-0.44117329729478644, -9.066731881842001)) → VOrthogonalLine(V, yAxis) → h_1Intersect(h_1, yAxis) → WVector(U, V) → u_1Vector(V, W) → v_1Textfield(M) → InputBox3
AI 绘图提示语参考
画一个函数图像,展示其垂直渐近线。首先标出x轴和函数图像的交点,然后绘制连接这些交点的向量。接着,从向量起点作垂线,与函数图像相交于两点,再从这两点分别作垂直于y轴的线,并标出交点。最后,绘制连接这些点的向量,并标注相关文字说明,以清晰展示垂直渐近线的定义和无限极限的概念。
以上提示语为根据原始绘图命令整理而来,仅供参考。