
指数指数分布的 GeoGebra 演示
几何画板及绘图内容加载中,请稍等……
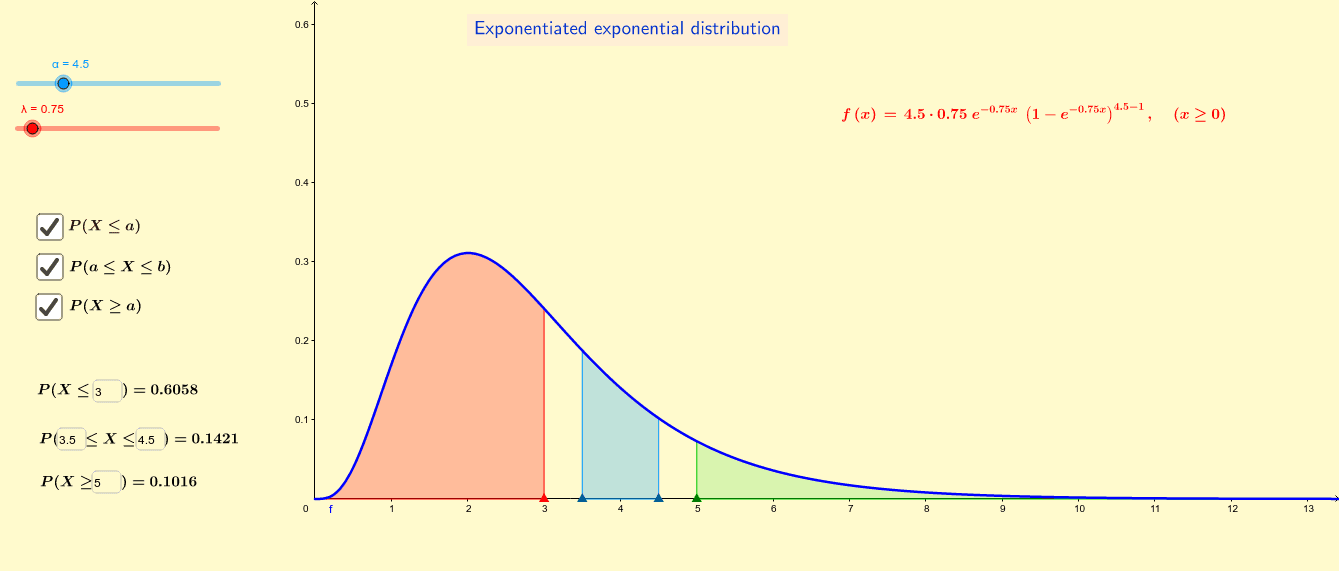
①本范例演示指数指数分布的函数图像及其性质;②涉及的核心数学概念包括概率统计、积分、函数图像绘制;③作图要点——从下方『构造摘要』提炼用到了 Point(点)、Integral(积分)、Textfield(文本框)、LaTeX(公式编辑)、对象s, α, λ, f, d, A, B, c, a, texto2, e, texto4, ct2, texto5, ct3, texto6, texto1, C, D, k, texto8, texto9, texto10, texto11, m, n, E, w, F, p, l, ct1, texto7, i, texto3, g, j, G, ct4, b;④适合高中及以上学生学习和理解概率统计中的复杂分布函数。
GeoGebra 命令及参数
Point(f) → APoint(f) → BIntegral(f, c, d) → aTextfield(c) → ct2Textfield(d) → ct3LaTeX(f, true, true) → texto8Point(f) → EIntegral(f, s, 500) → lTextfield(w) → ct1Integral(f, 0, w) → iTextfield(s) → ct4