
汽车行驶距离与速度关系探索
几何画板及绘图内容加载中,请稍等……
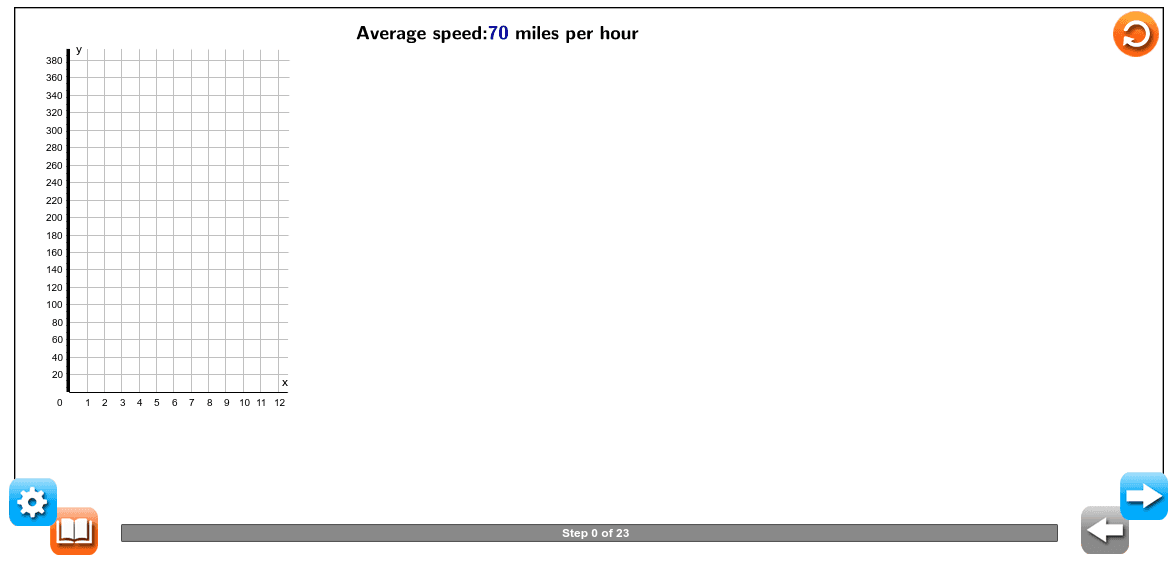
①本范例演示汽车行驶距离与速度关系的数学模型;②涉及核心数学概念包括函数、速度、距离、积分等;③构造要点使用了Polygon、LaTeX、VerticalText、Vector、TableText等GeoGebra命令和对象;④适合高中及以上学生学习和理解函数图像与实际应用的联系。
GeoGebra 命令及参数
Polygon(A, B, C, D) → PolyTop, a, b, c, dPolygon(E, F, G, H) → PolyRight, e, f, g, hLaTeX("\text{Identify the independent and dependent quantities.}") → Pg1ALaTeX("\text{that Eric traveled depends on the time in hours that he spent driving.}") → Pg1CLaTeX("\text{Choose variables to represent the independent and dependent quantities.}") → Pg1ELaTeX("\text{by the variable \textcolor{#000099}{t}.}") → Pg1GLaTeX("\text{by the variable \textcolor{#000099}{d}.}") → Pg1ILaTeX("\text{Write an equation to represent the relationship between the independent and dependent variables.}") → Pg1JLaTeX("\text{The distance in miles (\textcolor{#000099}{d}) that Eric traveled is calculated by multiplying his rate}") → Pg1KLaTeX((("\text{(\textcolor{#000099}{" * MPH) * "} miles per hour) by the time in hours (\textcolor{#000099}{t}) that he spent driving.}")) → Pg1LLaTeX("\text{Create a table to represent the relationship between the independent and dependent variables.}") → Pg2ALaTeX("\text{hours (\textcolor{#000099}{t}).}") → Pg2CLaTeX("\text{Use the table to create a graph that represents the relationship between the independent}") → Pg3ALaTeX("\text{and dependent variables.}") → Pg3BLaTeX("\text{coordinate plane.}") → Pg3DLaTeX("\text{Each row in the table of values provides a coordinate point that can be graphed on the}") → Pg3JLaTeX("\text{the coordinate plane to represent the relationship.}") → Pg3KLaTeX("\text{Because the speed traveled is at a constant rate, and because it is possible to have a}") → Pg3LLaTeX("\text{a line can be drawn through the coordinate points to show how the total distance traveled}") → Pg3NLaTeX("\text{was constantly changing.}") → Pg3OLaTeX("\text{This confirms the relationship shown in the table of values.}") → Pg4BVerticalText("\text{Total distance in miles \textcolor{#000099}{(d)}") → XaxisLaTeX("\text{Time in hours \textcolor{#000099}{(t)}") → YaxisVector(P1, P6) → uLaTeX("\text{Distance Traveled over Time}") → GrapheadPolygon(I, J, K, L) → RightConhide, i, j, k, lLaTeX("\text{event affects the probability of the outcome of another event.}") → WTK2LaTeX("\text{affect the probability of the outcome of another event.}") → WTK4LaTeX((("\text{Eric drove his car at \textcolor{#000099}{" * MPH) * "} miles per hour,which means that the total distance in miles}")) → Pg1BTableText({{"Time \;in\; hours \;\textcolor{#000099}{(t)}", LaTeX["\text{ \textcolor{#000099}{0} }"], LaTeX["\text{ \textcolor{#000099}{1 } }"], LaTeX["\text{ \textcolor{#000099}{2 } }"], LaTeX["\text{ \textcolor{#000099}{3} }"], LaTeX["\text{\textcolor{#000099}{ 4} }"], LaTeX["\text{ \textcolor{#000099}{5} }"]}, {"Total\; distance\; in\; miles \;\textcolor{#000099}{(d)}", LaTeX["\text{\textcolor{#000099}{\;0} }"], LaTeX[(("\text{ \textcolor{#000099}{" * MPH) * "} }")], LaTeX[(("\text{ \textcolor{#000099}{" * d2) * "} }")], LaTeX[(("\text{\textcolor{#000099}{ " * d3) * "} }")], LaTeX[(("\text{\textcolor{#000099}{" * d4) * "} }")], LaTeX[(("\text{\textcolor{#000099}{ " * d5) * "} }")]}}, "hl|_") → TableLaTeX((("\text{Average speed:\textcolor{#000099}{" * MPH) * "} miles per hour}")) → QuesLaTeX("\text{fractional number of hours (such as \textcolor{#000099}{2.5 \;hours}) instead of only a whole number of hours,}") → Pg3MLaTeX("\text{Therefore, the time is the independent quantity, and the distance is the dependent quantity.}") → Pg1DLaTeX("\text{Because “time” starts with the letter “\textcolor{#000099}{t},” let the time Eric spent driving be represented}") → Pg1FLaTeX("\text{Because “distance” starts with the letter “\textcolor{#000099}{d},” let the distance Eric traveled be represented}") → Pg1HLaTeX((("\text{Therefore, the relationship can be represented by the equation \textcolor{#000099}{d = " * MPH) * "t}.}")) → Pg1MLaTeX("\text{Use the left column of the table for the values of the independent variable, the time in}") → Pg2BLaTeX("\text{Use the right column for the values of the dependent variable, the total distance in miles (\textcolor{#000099}{d}).}") → Pg2DLaTeX((("\text{To fill in the table, choose values for \textcolor{#000099}{t} to substitute into the equation \textcolor{#000099}{d = " * MPH) * "t.}}")) → Pg2ELaTeX((((("\text{second column, let \textcolor{#000099}{t = 1}, so \textcolor{#000099}{d = " * MPH) * "(1)}, which simplifies to \textcolor{#000099}{d = ") * MPH) * "}, and so on, as shown.}")) → Pg2GLaTeX((("\text{In the first column of the table, let \textcolor{#000099}{t = 0}, so \textcolor{#000099}{d = " * MPH) * "(0)}, which simplifies to \textcolor{#000099}{d = 0}. In the}")) → Pg2FLaTeX("\text{Based on the table, as the time increases, the total distance also increases.}") → Pg2HLaTeX("\text{The independent quantity, the time in hours (\textcolor{#000099}{t}), is plotted along the \textcolor{#000099}{x}-axis of the}") → Pg3CLaTeX("\text{The dependent quantity, the total distance in miles (\textcolor{#000099}{d}), is plotted along the \textcolor{#000099}{y}-axis.}") → Pg3ELaTeX("\text{It is not possible to have a negative amount of time, so the \textcolor{#000099}{x}-axis starts at \textcolor{#000099}{0}. Likewise,}") → Pg3FLaTeX("\text{it is not possible to travel a negative total distance, so the \textcolor{#000099}{y}-axis also starts at \textcolor{#000099}{0}.}") → Pg3GLaTeX("\text{Label the \textcolor{#000099}{x}-axis “Time in hours” and label the \textcolor{#000099}{y}-axis “Total distance in miles.”}") → Pg3HLaTeX("\text{The title of the graph can be “Distance Traveled over Time.”}") → Pg3ILaTeX("\text{This graph shows that as the time increases, the total distance traveled also increases.}") → Pg4ALaTeX("\text{\mathbf{dependent\;events} events that are not independent. The outcome of one}") → Wtk1LaTeX("\text{\mathbf{independent\;events} events such that the outcome of one event does not}") → WTK3LaTeX((("\text{Average speed=" * MPH) * " miles per hour}")) → DK1