
银行排队等待时间与前方人数关系图示
几何画板及绘图内容加载中,请稍等……
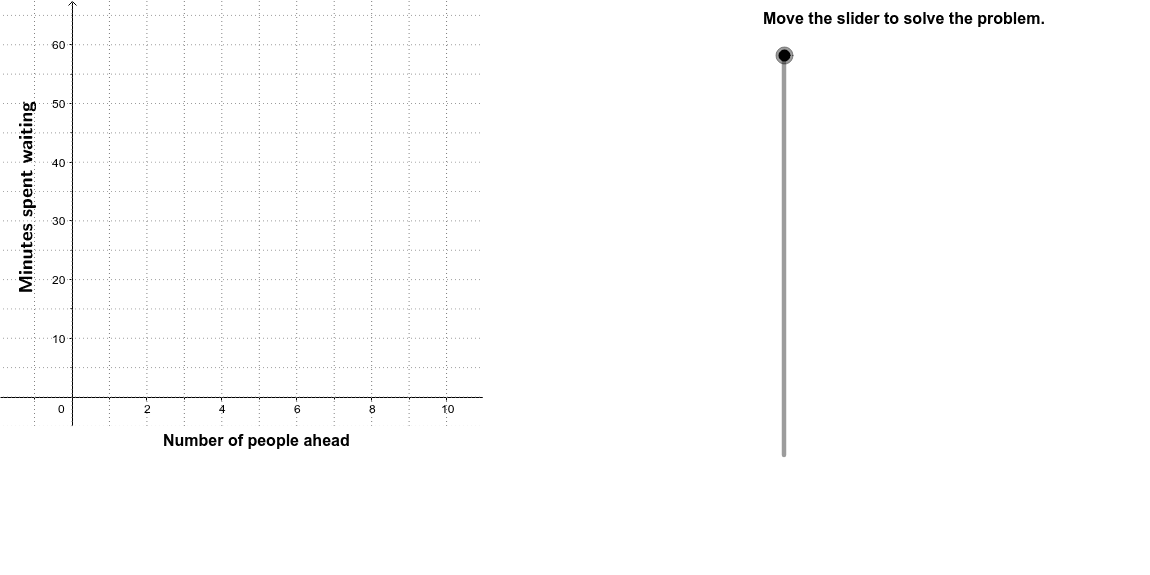
这个范例演示了银行排队中顾客等待时间与进入时前方人数的关系图,通常以散点图或函数图形式呈现。涉及的核心数学概念包括函数关系、散点图、可能涉及线性回归或参数方程。作图要点:使用GeoGebra命令如Polygon绘制多边形,TextField添加文本,Line和Segment绘制线段,Sequence生成序列,RotateText旋转文本;对象如P_2, P_1定义点,DirectionsSlider控制方向,A1-A7, B1-B7可能表示数据点。适合高中数学或统计学课程,用于教学数据可视化和函数建模。
GeoGebra 命令及参数
Polygon((11, y(Corner[2])), Corner[2], Corner[3], (11, y(Corner[4]))) → poly1, a, c, d, eTextfield(A1) → InA1Textfield(A2) → InA2Textfield(A3) → InA3Textfield(A4) → InA4Textfield(A5) → InA5Textfield(B1) → InB1Textfield(B2) → InB2Textfield(B3) → InB3Textfield(B4) → InB4Textfield(B5) → InB5Line(P_1, P_2) → gTextfield(A6) → InA6Textfield(A7) → InA7Textfield(B6) → InB6Textfield(B7) → InB7Sequence(Segment[(13.5, 13 + (6 * i)), (18, 13 + (6 * i))], i, 0, 7) → LinesHorSegment((13.5, 66), (18, 66)) → TopSegment((13.5, 13), (13.5, 66)) → Side1Segment((18, 13), (18, 66)) → Side2Segment((15.75, 13), (15.75, 66)) → MidLineSequence(x = i, i, -2, 11) → Hash1Sequence(y = (5 * i), i, -2, 13) → Hash2RotateText("Minutes spent waiting", 90*°) → SideLegand2Polygon((11, -5), (-2, -5), Corner[1], (11, y(Corner[1]))) → poly2, f, h, i, j