
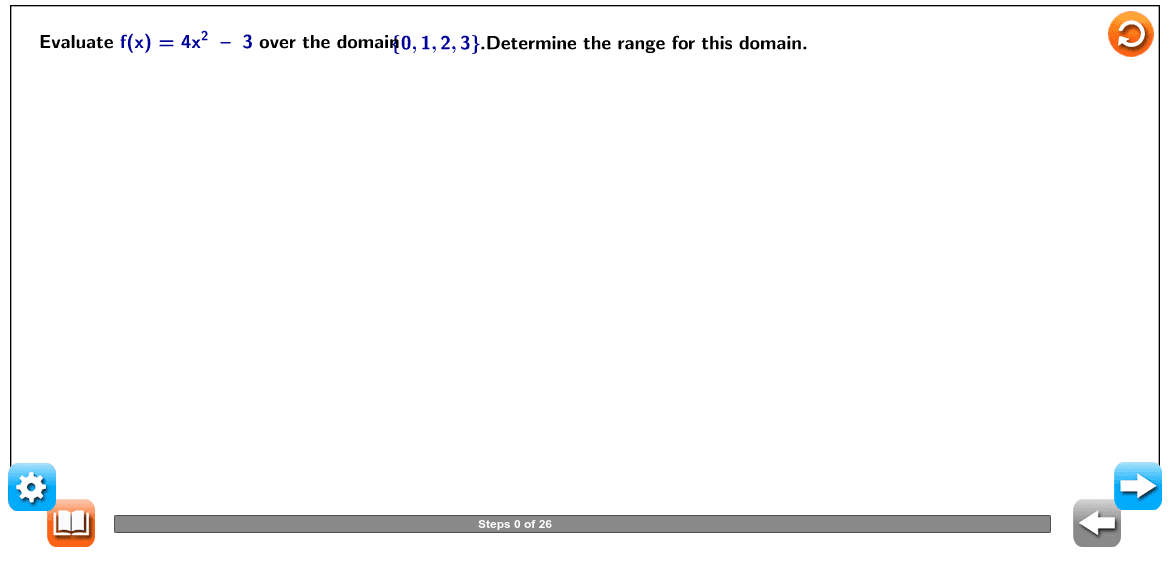
求二次函数f(x)=4x²-3在离散定义域上的值域
几何画板及绘图内容加载中,请稍等……
该范例演示了如何对给定的二次函数 f(x)=4x²-3 在离散定义域 {0,1,2,3} 上求值并确定其值域。核心数学概念是函数定义域与值域的对应关系,以及二次函数在有限点集上的取值规律。作图要点包括:使用 GeoGebra 的 Sequence 命令生成定义域中的离散点,通过 LaTeX 显示函数表达式,利用 Segment 或 Vector 连接点与坐标轴以可视化对应关系,并借助 Slider 或按钮(如 Next、Prev)逐步展示计算过程。该范例适合初中或高中阶段学习函数基础概念的学生,用于理解函数映射、列表法表示函数以及离散值域的求解方法,也可作为交互式课堂演示材料。
GeoGebra 命令及参数
Segment(A_0, B_0) → ScalelineSequence(Segment[A_0 + (i, 0), A_0 + (i, (-0.5))], i, 0, 10) → list1Sequence(Segment[A_0 + (i - 0.5, 0), A_0 + (i - 0.5, (-0.4))], i, 1, 10) → list2Sequence(Sequence[Segment[A_0 + ((0.5 * i) + (0.1 * j), 0), A_0 + ((0.5 * i) + (0.1 * j), (-0.3))], j, 1, 4], i, 0, 19) → list3LaTeX("\text{0}") → Scalevalue0LaTeX("\text{1}") → Scalevalue1LaTeX("\text{2}") → Scalevalue2LaTeX("\text{3}") → Scalevalue3LaTeX("\text{4}") → Scalevalue4LaTeX("\text{5}") → Scalevalue5LaTeX("\text{6}") → Scalevalue6LaTeX("\text{7}") → Scalevalue7LaTeX("\text{8}") → Scalevalue8LaTeX("\text{9}") → Scalevalue9LaTeX("\text{10}") → Scalevalue10Segment(D_0, (x(D_0), 0)) → jVector(C_0, D_0) → uLaTeX("\text{Evaluate the function for each of the domain values.") → text4LaTeX("\text{Given function}") → text11LaTeX("\text{Simplify.}") → text15LaTeX((((("\text{ \textcolor{#000099}{f(" * val0) * ") = ") * sub1) * "}}")) → text14LaTeX("\text{Given function}") → text11_1LaTeX("\text{Simplify.}") → text15_1LaTeX("\text{Given function}") → text11_2LaTeX("\text{Simplify.}") → text15_2LaTeX("\text{Given function}") → text11_3LaTeX("\text{Simplify.}") → text15_3LaTeX((((("\text{ \textcolor{#000099}{f(" * val2) * ") = ") * sub3) * "}}")) → text14_2LaTeX((((("\text{ \textcolor{#000099}{f(" * val3) * ") = ") * sub4) * "}}")) → text14_3LaTeX("\text{Determine the range of the function for the given domain.}") → text17LaTeX("\text{Therefore, the range of the function over the given domain is}") → text21Segment((0, 0), (0, 1.6)) → iSegment(F_0, (x(F_0), 0)) → kVector(E_0, F_0) → vLaTeX("\text{.Determine the range for this domain.}") → text3LaTeX((((("\text{ \textcolor{#000099}{f(" * val1) * ") = ") * sub2) * "}}")) → text14_1Factors(24) → factLaTeX((("\text{Constant=" * valuec) * "}")) → text23LaTeX((((("\text{Evaluate \textcolor{#000099}{f(x) = " * valuex) * "x² \;– \;") * valuec) * "} over the domain}")) → text1LaTeX((("\text{Evaluate \textcolor{#000099}{f(" * val0) * ")}.}")) → text9LaTeX((("\text{Evaluate \textcolor{#000099}{f(" * val1) * ")}.}")) → text9_1LaTeX((("\text{Evaluate \textcolor{#000099}{f(" * val2) * ")}.}")) → text9_2LaTeX((("\text{Substitute \textcolor{#000099}{" * val2) * "} for \textcolor{#000099}{x}.}")) → text13_2LaTeX((("\text{Evaluate \textcolor{#000099}{f(" * val3) * ")}.}")) → text9_3LaTeX((("\text{Substitute \textcolor{#000099}{" * val3) * "} for \textcolor{#000099}{x}.}")) → text13_3LaTeX("\text{values we substituted for \textcolor{#000099}{x}.}") → text19LaTeX((("\text{Substitute \textcolor{#000099}{" * val1) * "} for \textcolor{#000099}{x}.}")) → text13_1LaTeX("\text{\mathbf{Quadratic \;function} a function that can be written in the form \textcolor{#000099}{f(x) = ax² + bx + c}, }") → text24LaTeX("\text{where \textcolor{#000099}{a ≠ 0}. The graph of any quadratic function is a parabola.}") → text25LaTeX("\text{ function.}") → text27LaTeX("\text{ function.}") → text29LaTeX((("\text{Substitute \textcolor{#000099}{" * val0) * "} for \textcolor{#000099}{x}.}")) → text13LaTeX((("\text{Coefficient of x=" * valuex) * "}")) → text2LaTeX("\text{ \mathbf{Domain} the set of all inputs of a function; the set of \textcolor{#000099}{x}-values that are valid for the}") → text26LaTeX("\text{\mathbf{Range} the set of all outputs of a function; the set of \textcolor{#000099}{y}-values that are valid for the }") → text28LaTeX((("\text{\textcolor{#000099}{" * sub1) * "}.}")) → text30LaTeX("\text{The outputs from the previous step were}") → text20LaTeX((((("\text{To evaluate the function \textcolor{#000099}{f(x) = " * valuex) * "x² -") * valuec) * "} over the domain")) → text5LaTeX((((("\text{into \textcolor{#000099}{f(x) = " * valuex) * "x²-") * valuec) * "}.")) → text8LaTeX((((("\text{ \textcolor{#000099}{f(x) = " * valuex) * "x²-") * valuec) * "}}")) → text10LaTeX((((((((("\text{ \textcolor{#000099}{f(" * val0) * ") = ") * valuex) * "(") * val0) * ")²-") * valuec) * "}}")) → text12LaTeX((((("\text{ \textcolor{#000099}{f(x) = " * valuex) * "x²-") * valuec) * "}}")) → text10_1LaTeX((((((((("\text{ \textcolor{#000099}{f(" * val1) * ") = ") * valuex) * "(") * val1) * ")² -") * valuec) * "}}")) → text12_1LaTeX((((("\text{ \textcolor{#000099}{f(x) = " * valuex) * "x²-") * valuec) * "}}")) → text10_2LaTeX((((((((("\text{ \textcolor{#000099}{f(" * val2) * ") = ") * valuex) * "(") * val2) * ")²-") * valuec) * "}}")) → text12_2LaTeX((((("\text{ \textcolor{#000099}{f(x) = " * valuex) * "x²-") * valuec) * "}}")) → text10_3LaTeX((((((((("\text{ \textcolor{#000099}{f(" * val3) * ") = ") * valuex) * "(") * val3) * ")²-") * valuec) * "}}")) → text12_3LaTeX("\text{, substitute the values from the domain") → text7LaTeX((((("\text{When \textcolor{#000099}{" * val0) * "} is substituted for \textcolor{#000099}{x},the value of \textcolor{#000099}{f(") * val0) * ")} is}")) → text16LaTeX((((((("\text{When \textcolor{#000099}{" * val1) * "} is substituted for \textcolor{#000099}{x},the value of \textcolor{#000099}{f(") * val1) * ")} is \textcolor{#000099}{") * sub2) * "}.}")) → text16_1LaTeX((((((("\text{When \textcolor{#000099}{" * val2) * "} is substituted for \textcolor{#000099}{x},the value of \textcolor{#000099}{f(") * val2) * ")} is \textcolor{#000099}{") * sub3) * "}.}")) → text16_2LaTeX((((((("\text{When \textcolor{#000099}{" * val3) * "} is substituted for \textcolor{#000099}{x},the value of \textcolor{#000099}{f(") * val3) * ")} is \textcolor{#000099}{") * sub4) * "}.}")) → text16_3LaTeX((((((((("\text{\textcolor{#000099}{" * sub1) * ", ") * sub2) * ",") * sub3) * ", and \; ") * sub4) * "}.}")) → text31LaTeX("\text{Collect the set of outputs for the inputs.Recall that the outputs are the \textcolor{#000099}{f(x)} values,and the inputs are the}") → text18
AI 绘图提示语参考
绘制一个二次函数f(x)=4x²-3在离散域{0,1,2,3}上的图像,展示输入值到输出值的映射关系。首先画出x轴上的刻度标记0到10,并标注对应的数值。然后,对于每个输入值,用线段连接输入点到其对应的函数值点,形成函数图像。最后,标注函数表达式,并标出函数值的集合,即函数的值域。
以上提示语为根据原始绘图命令整理而来,仅供参考。