
拖拽点绘制直方图
几何画板及绘图内容加载中,请稍等……
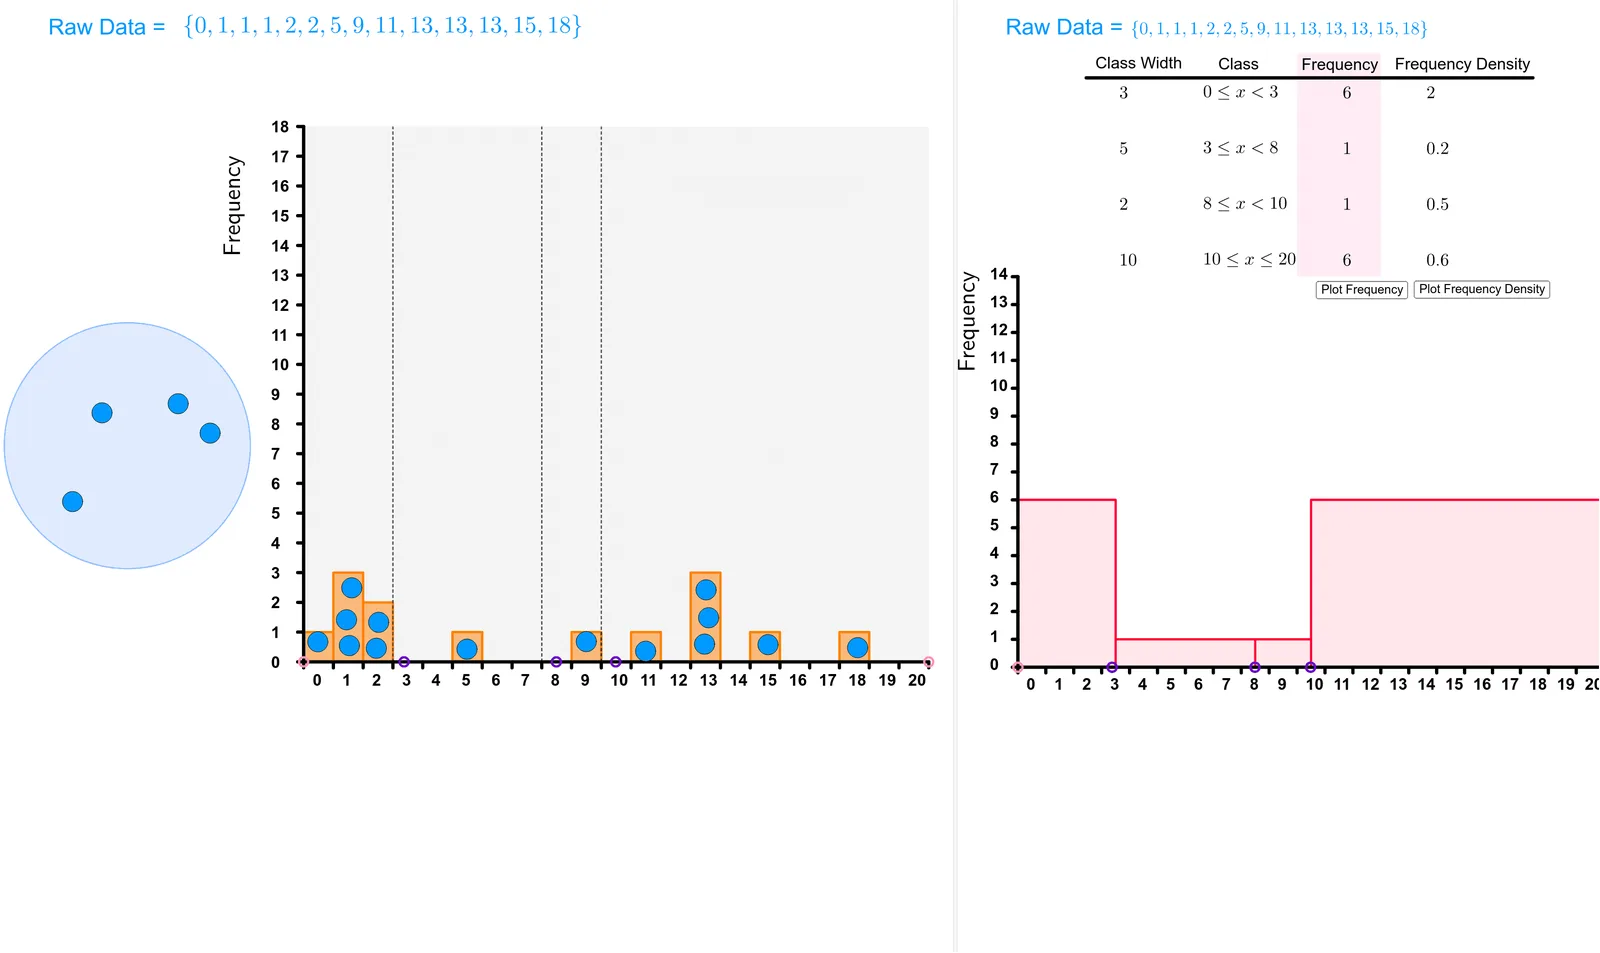
该范例演示了如何通过拖拽点来绘制直方图。涉及的核心数学概念包括直方图的构建、面积计算以及线段的使用。通过使用GeoGebra命令如Polygon、Segment、Histogram等,可以动态地展示数据分布情况。适合高中及以上学生或教师用于教学和学习概率统计。
GeoGebra 命令及参数
Polygon(A, B, C, D) → Region, a, b, c, dSegment(A, D) → NumberlineCircle(W, Z) → HoldingPenRemoveUndefined(Sort[AllPoints]) → PointsInRegionSequence(Text[i, (i - 0.2, -0.8)], i, 0, 20, 1) → TicksTextHistogram({-0.5, 0.5, 1.5, 2.5, 3.5, 4.5, 5.5, 6.5, 7.5, 8.5, 9.5, 10.5, 11.5, 12.5, 13.5, 14.5, 15.5, 16.5, 17.5, 18.5, 19.5, 20.5}, PointsInRegion) → histogramSegment(A_1, B_1) → fFrequency({-1, x2}, PointsInRegion) → f1listFrequency({x2, x3}, PointsInRegion) → f2listFrequency({x3, x4}, PointsInRegion) → f3listFrequency({x4, 20.5}, PointsInRegion) → f4listElement(f1list, 1) → f1Element(f2list, 1) → f2Element(f3list, 1) → f3Element(f4list, 1) → f4Histogram({-0.5, x2, x3, x4, 20.5}, {d1, d2, d3, d4}) → FreqDensHistSequence(Segment[(i, 0), (i, -0.2)], i, -0.5, 20.5) → TicksLaTeX(text10, true, true) → text23Segment(A, (-0.5, 18)) → jSequence(Text[i, (-1.6, i - 0.2)], i, 0, 18) → l3Sequence(Segment[(-0.7, i), (-0.5, i)], i, 0, 18) → l4RotateText(text24, 90°) → text25RotateText("Frequency Density", 90°) → text26Histogram({-0.5, x2, x3, x4, 20.5}, {f1, f2, f3, f4}) → FreqHistRotateText("Frequency", 90°) → text27Segment(A, (-0.5, 14)) → FreqDensLineSequence(Text[i, (-1.5, i - 0.1)], i, 0, 14) → l1Sequence(Segment[(-0.7, i), (-0.5, i)], i, 0, 14) → l2Polygon(C_1, D_1, E_1, F_1) → q1, c_1, d_1, e_1, f_1Polygon(G_1, H_1, I_1, J_1) → q2, g_1, h_1, i_1, j_1Segment((x2 - 0.5, 0), (x2 - 0.5, 18)) → iSegment((x3 - 0.5, 0), (x3 - 0.5, 18)) → kSegment((x4 - 0.5, 0), (x4 - 0.5, 18)) → l
AI 绘图提示语参考
画一个直方图,通过拖动点来创建。首先绘制一个由四个点组成的矩形区域,然后在这个区域内生成一些点。根据这些点的位置,计算每个区间的频率,并用矩形表示这些频率。在直方图的底部绘制水平线段作为刻度,并在旁边标注频率密度和频率。最后,将直方图分为四个部分,分别用不同的颜色表示,并在顶部标注标题。
以上提示语为根据原始绘图命令整理而来,仅供参考。