
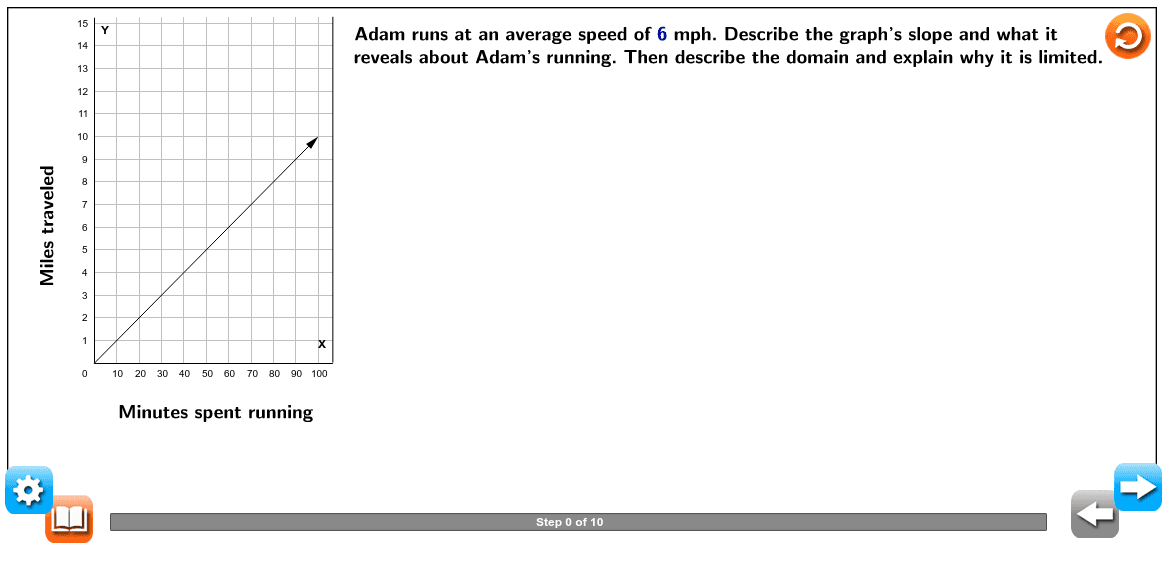
亚当跑步距离与时间关系图
几何画板及绘图内容加载中,请稍等……
这个范例展示了亚当跑步时,根据跑步时间,他所跑过的距离变化情况。核心数学概念包括函数图象和速度-时间关系。通过使用GeoGebra命令如Vector、Point、Intersect等,可以构造出直观的跑步距离与时间关系图。适合初中及以上学生学习函数图象和实际应用。
GeoGebra 命令及参数
SelectedIndex(Miles) → GetmilesVector(A, B) → uOrthogonalLine(B, xAxis) → bOrthogonalLine(B, b) → cPoint(c) → COrthogonalLine(C, c) → dPoint(xAxis) → DOrthogonalLine(D, d) → eIntersect(b, e) → ESegment(B, C) → ToplinefSegment(B, E) → SidelinegPolygon(F, G, H, I) → GCSplitpoly1, f, g, h, iPolygon(J, K, L, M) → Gtoppoly1, j, k, l, mSegment(N, O) → nSegment(N, P) → pSegment(P, Q) → qIntersect(f, k) → RPoint(f) → SSegment(R, S) → rLaTeX("\text{Minutes spent running}") → XGraminsVerticalText("Miles traveled") → YGramilLaTeX("\text{Describe the slope of the line.}") → PG1ELaTeX("\text{The line increases from left to right; therefore, its slope is positive.}") → PG1FLaTeX("\text{Explain what the slope of the line reveals about Adam’s running.}") → PG1ILaTeX("\text{Because the slope is positive and the function increases as time passes, this means}") → PG1JLaTeX("\text{that the longer Adam runs, the farther he will go.}") → PG1KLaTeX("\text{Describe the domain.}") → PG2ALaTeX("\text{The graph starts at the origin and continues through Quadrant I. No negative values}") → PG2CLaTeX("\text{Explain why the domain is limited.}") → PG2ELaTeX("\text{Note that the scale on the \textcolor{#000099}{x}-axis is in increments of \textcolor{#000099}{5} instead of \textcolor{#000099}{1}. If the scale on}") → PG1GLaTeX("\text{the \textcolor{#000099}{x}-axis were the same as the scale on the \textcolor{#000099}{y}-axis, the slope would be steeper.}") → PG1HLaTeX("\text{The domain is the set of all possible \textcolor{#000099}{x}-values for a function.}") → PG2BLaTeX("\text{for \textcolor{#000099}{x} are shown. Thus, the domain is \textcolor{#000099}{x ≥ 0}.}") → PG2DLaTeX("\text{In this situation, \textcolor{#000099}{x} represents the amount of time Adam spends running. Because}") → PG2FLaTeX("\text{it is impossible to have a negative amount of time, \textcolor{#000099}{x} cannot be less than \textcolor{#000099}{0}.}") → PG2GLaTeX("\text{Therefore, the domain is limited to values greater than or equal to \textcolor{#000099}{0}.}") → PG2HIntersect(l, m) → A_1Polygon(A_1, D_1, E_1, F_1) → Hideright, a_1, d_1, e_1, f_1Point(k) → G_1Point(q) → H_1Segment(G_1, H_1) → sPolygon(I_1, K_1, L_1, M_1) → Gtopnew, i_1, k_1, l_1, m_1LaTeX((("\text{ Adam runs at an average speed of \textcolor{#000099}{" * Getmiles) * "} mph. Describe the graph’s slope and what it}")) → PG1ALaTeX("\text{ reveals about Adam’s running. Then describe the domain and explain why it is limited.}") → PG1CLaTeX("\text{\mathbf{slope} the measure of the rate of change of one variable with respect to another }") → text3LaTeX("\text{without restriction}") → text2LaTeX("\text{\mathbf{domain} the set of all input values (\textcolor{#000099}{x}-values) that satisfy the given function }") → WTK4LaTeX("\text{variable;\textcolor{#000099}{slope=\frac{y₂-y₁}{x₂-x₁}=\frac{\Delta y}{\Delta x}=\frac{rise}{run}}; the slope in the equation \textcolor{#000099}{{y = mx + b}} is \textcolor{#000099}{m}.}") → text5
AI 绘图提示语参考
画一个距离-时间图,展示一个人跑步的距离随时间的变化。图中应包含一个表示距离随时间增加的斜线,起点在原点,延伸到第一象限。需要标注横轴为时间(分钟),纵轴为距离(英里)。在图中添加文字说明,解释斜线的正斜率表示跑步者速度恒定且在前进,并说明定义域为非负数的原因是时间不能为负。
以上提示语为根据原始绘图命令整理而来,仅供参考。