
收集、组织与汇总数据练习
几何画板及绘图内容加载中,请稍等……
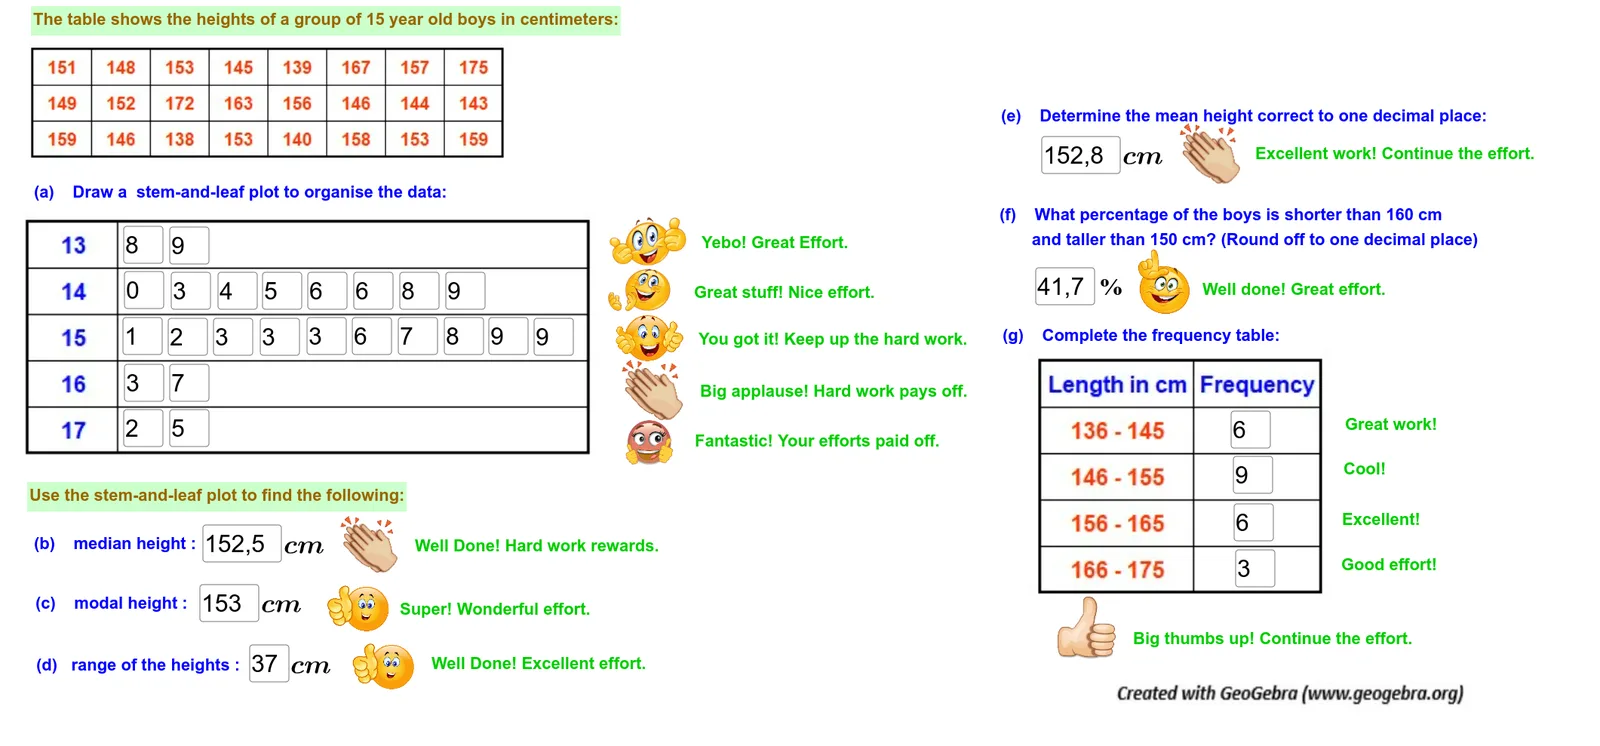
①本范例演示了如何通过GeoGebra工具收集、组织并汇总数据,涉及统计与几何构造;②核心数学概念包括统计数据的处理、预期值计算、立方体构造、外接圆构建及分形几何;③作图要点提炼自构造摘要,使用了Textfield、按钮(knop1, knop2)、输入框(InputBox)、文本对象(text1至text39)等GeoGebra命令与对象;④适合高中阶段数学教学,用于数据统计与几何构造的实践应用。
GeoGebra 命令及参数
Textfield(text10) → InputBox2Textfield(text31) → InputBox8Textfield(text19) → InputBox5Textfield(text46) → InputBox9Textfield(text17) → InputBox4Textfield(text41) → InputBox6Textfield(text16) → InputBox7Textfield(text75) → InputBox13Textfield(text81) → InputBox18Textfield(text85) → InputBox20Textfield(text18) → InputBox1Textfield(text51) → InputBox3Textfield(text5) → InputBox10Textfield(text8) → InputBox11Textfield(text53) → InputBox12Textfield(text56) → InputBox14Textfield(text4) → InputBox15Textfield(text58) → InputBox16Textfield(text62) → InputBox17Textfield(text66) → InputBox19Textfield(text67) → InputBox21Textfield(text69) → InputBox22Textfield(text72) → InputBox23Textfield(text74) → InputBox24Textfield(text78) → InputBox25Textfield(text82) → InputBox26Textfield(text83) → InputBox27Textfield(text88) → InputBox28Textfield(text91) → InputBox29Textfield(text93) → InputBox30Textfield(text94) → InputBox31Textfield(text95) → InputBox32Textfield(text96) → InputBox33
AI 绘图提示语参考
创建一个统计与几何构造的示例,包含多个文本框、输入框和按钮,用于数据收集、整理和总结。展示如何通过统计数据处理和期望值计算,结合立方体、 circumcircle 和分形几何的构造,实现数据的可视化。文本框与输入框相互关联,按钮用于控制交互,整体构造需体现数据统计与几何实践的融合。
以上提示语为根据原始绘图命令整理而来,仅供参考。