
选择区域的面积直方图
几何画板及绘图内容加载中,请稍等……
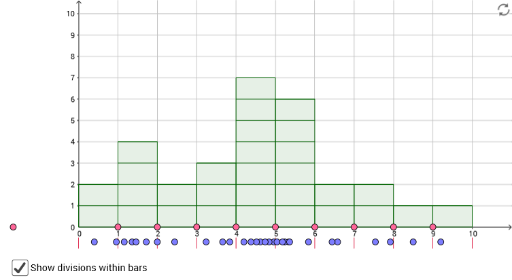
本范例通过选择不同的区域来展示面积直方图。涉及的核心数学概念包括面积计算、统计学中的直方图以及积分计算。通过使用GeoGebra命令如Append、Insert、Point等,可以构造出动态的面积直方图。适合高中及以上学生或教师用于教学和学习。
GeoGebra 命令及参数
Append(dividerlist, 10) → barrightsInsert(0, dividerlist, 1) → barleftsPoint(Segment[(0, pointheight), (10, pointheight)]) → A1Point(Segment[(0, pointheight), (10, pointheight)]) → A2Point(Segment[(0, pointheight), (10, pointheight)]) → A3Point(Segment[(0, pointheight), (10, pointheight)]) → A4Point(Segment[(0, pointheight), (10, pointheight)]) → A5Point(Segment[(0, pointheight), (10, pointheight)]) → A6Point(Segment[(0, pointheight), (10, pointheight)]) → A7Point(Segment[(0, pointheight), (10, pointheight)]) → A8Point(Segment[(0, pointheight), (10, pointheight)]) → A9Point(Segment[(0, pointheight), (10, pointheight)]) → A10Point(Segment[(0, pointheight), (10, pointheight)]) → A11Point(Segment[(0, pointheight), (10, pointheight)]) → A12Point(Segment[(0, pointheight), (10, pointheight)]) → A13Point(Segment[(0, pointheight), (10, pointheight)]) → A14Point(Segment[(0, pointheight), (10, pointheight)]) → A15Point(Segment[(0, pointheight), (10, pointheight)]) → A16Point(Segment[(0, pointheight), (10, pointheight)]) → A17Point(Segment[(0, pointheight), (10, pointheight)]) → A18Point(Segment[(0, pointheight), (10, pointheight)]) → A19Point(Segment[(0, pointheight), (10, pointheight)]) → A20Point(Segment[(0, pointheight), (10, pointheight)]) → A21Point(Segment[(0, pointheight), (10, pointheight)]) → A22Point(Segment[(0, pointheight), (10, pointheight)]) → A23Point(Segment[(0, pointheight), (10, pointheight)]) → A24Point(Segment[(0, pointheight), (10, pointheight)]) → A25Point(Segment[(0, pointheight), (10, pointheight)]) → A26Point(Segment[(0, pointheight), (10, pointheight)]) → A27Point(Segment[(0, pointheight), (10, pointheight)]) → A28Point(Segment[(0, pointheight), (10, pointheight)]) → A29Point(Segment[(0, pointheight), (10, pointheight)]) → A30Point(xAxis) → B1Point(xAxis) → B2Point(xAxis) → B3Point(xAxis) → B4Point(xAxis) → B5Point(xAxis) → B6Point(xAxis) → B7Point(xAxis) → B8Point(xAxis) → B9Point(xAxis) → B10Length(dividerlist) → numdividersZip(Sum[(x(A1:A30) ≥ L) ∧ (x(A1:A30) < R)], L, barlefts, R, barrights) → barcountsSum(barcounts) → aZip(R - L, L, barlefts, R, barrights) → barwidthsSum(barwidths) → bZip(Polygon[{(L, 0), (L, H), (R, H), (R, 0)}], L, barlefts, R, barrights, H, barheights) → barsSum(bars) → cZip(Segment[(L, -0.5), (L, -1)], L, Append[barlefts, 10]) → list1Zip(Zip[Segment[(L, (H / N * j)), (R, (H / N * j))], j, Sequence[N]], L, barlefts, R, barrights, H, barheights, N, barcounts) → bardividers