
Zeros of Quadratic Function with Graph
Loading the math board and drawing, please wait…
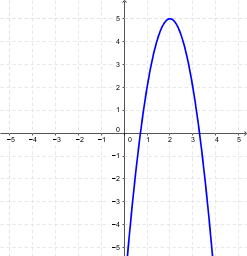
This example demonstrates the zeros of a quadratic function and its graphical representation. Key math concepts include quadratic functions, zeros, discriminant, complex numbers, and geometric transformations. It is constructed using GeoGebra commands like RandomElement, KeepIf, Intersect, Mirror, Circle, OrthogonalLine, and objects such as xmax, xmin, etc. Suitable for high school mathematics teaching to understand the properties of quadratic functions and graphical transformations.
GeoGebra Commands & Parameters
RandomElement(KeepIf[(x ≠ 0) ∧ (x ≥ Max[xmin, ymin]) ∧ (x ≤ Min[xmax, ymax]), Sequence[i, i, (-abs((xmin * ymin))), abs((xmax * ymax)) + If[rs, 0, 0]]]) → numbersectionexamKeepIf(x ≠ 0, Sequence[i, i, -3, 3 + If[rs, 0, 0]]) → list4aRandomElement(KeepIf[x ≠ 0, Sequence[i, i, -5, 5 + If[rs, 0, 0]]]) → numverSelectionwithExcludingKeepIf(x ≠ 0, Sequence[i, i, -3, 3 + If[rs, 0, 0]]) → list4bRandomElement(list4a) → ranaRandomElement(list4b) → ranbTool2(rana, ranc, ((2 * rana) * ranb)) → text1Intersect(f, xAxis) → A, BMirror(f, g) → f_1Intersect(xAxis, f_1) → C, DCircle(M, C) → cOrthogonalLine(M, xAxis) → hIntersect(c, h) → E, F