
Z-Test of a Mean
Loading the math board and drawing, please wait…
In collections
学习 GeoGebra 经典应用
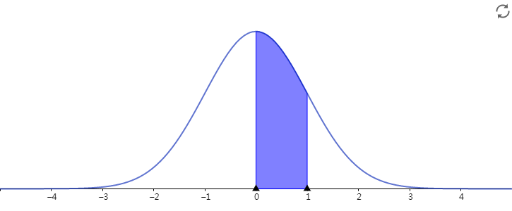
The Z-Test of a Mean is a statistical method used to determine if the sample mean differs significantly from the population mean. This example demonstrates how to construct the z-test using GeoGebra, focusing on concepts like mean, standard deviation, and z-score. The construction involves using mean, standard deviation, and sample mean objects. Suitable for high school or university students in statistics courses to understand hypothesis testing principles.
AI Drawing Prompt Reference
Create an illustrative diagram for a “Z-Test of a Mean” to show the relationships among population mean, sample mean, and standard deviation. On a single coordinate system, draw reference positions for the population mean and the sample mean as separate vertical lines. Mark the distribution’s spread using standard deviation as scale marks along the number axis. Indicate the offset between the sample mean and the population mean, and label how this offset corresponds to the z-score notion by representing the distance from the population mean to the sample mean in standardized terms. Use clear annotations to convey how the test assesses whether the means differ significantly.
The prompt above was compiled from the original drawing commands and is for reference only.