
Z Confidence Interval Variation Demo
Loading the math board and drawing, please wait…
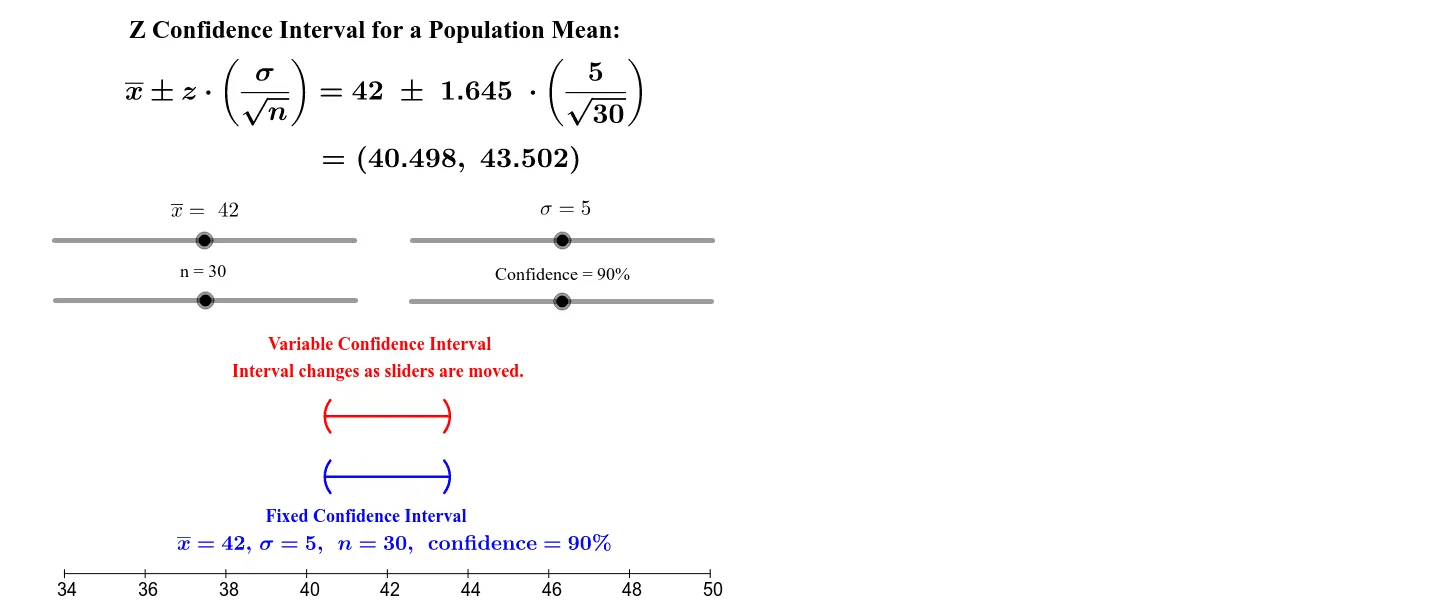
This example demonstrates the dynamic variation of Z confidence intervals and their graphical representation. It involves core mathematical concepts such as confidence intervals, upper and lower bounds, exponential functions, piecewise functions, combinatorics, and trigonometry. The construction uses GeoGebra commands like Segment, CircleArc, and Sequence. Suitable for high school and above, particularly in probability & statistics and calculus education.
GeoGebra Commands & Parameters
Segment(LeftFixEnd, RightFixEnd) → FixIntSegment(LeftVarEnd, RightVarEnd) → VarIntCircleArc(LeftFixCent, LeftFixTop, LeftFixBot) → LeftFixCapCircleArc(RightFixCent, RightFixBot, RightFixTop) → RightFixCapCircleArc(LeftVarCent, LeftVarTop, LeftVarBot) → LeftVarCapCircleArc(RightVarCent, RightVarBot, RightVarTop) → RightVarCapSegment(P34, P50) → XaxisSequence(Segment[(k, 0), (k, -0.2)], k, 34, 50, 2) → TicsSequence(Text[k, (k - 0.175, -0.65)], k, 34, 50, 2) → Labels
AI Drawing Prompt Reference
Draw a graph showing the dynamic variation of Z confidence intervals, including fixed and variable endpoints forming the intervals, represented by arcs for upper and lower bounds, with an axis and tick marks to illustrate the changes and mathematical relationships of the confidence intervals.
The prompt above was compiled from the original drawing commands and is for reference only.