
y = mx + c Drag Demonstration
Loading the math board and drawing, please wait…
In collections
Linear functions
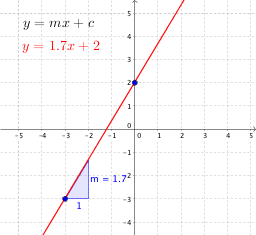
This example demonstrates the graphical change of the linear equation y=mx+c as the slope m and y-intercept c vary. It involves core math concepts like linear functions, slope, y-intercept, and analytical geometry. Constructed using GeoGebra commands/objects such as Point, Line, and Slope. Suitable for middle school students and above learning the properties of linear function graphs or for mathematical teaching demonstrations.
GeoGebra Commands & Parameters
Point(yAxis) → BLine(A, B) → aSlope(a) → m