
X and Y Scatter Plot
Loading the math board and drawing, please wait…
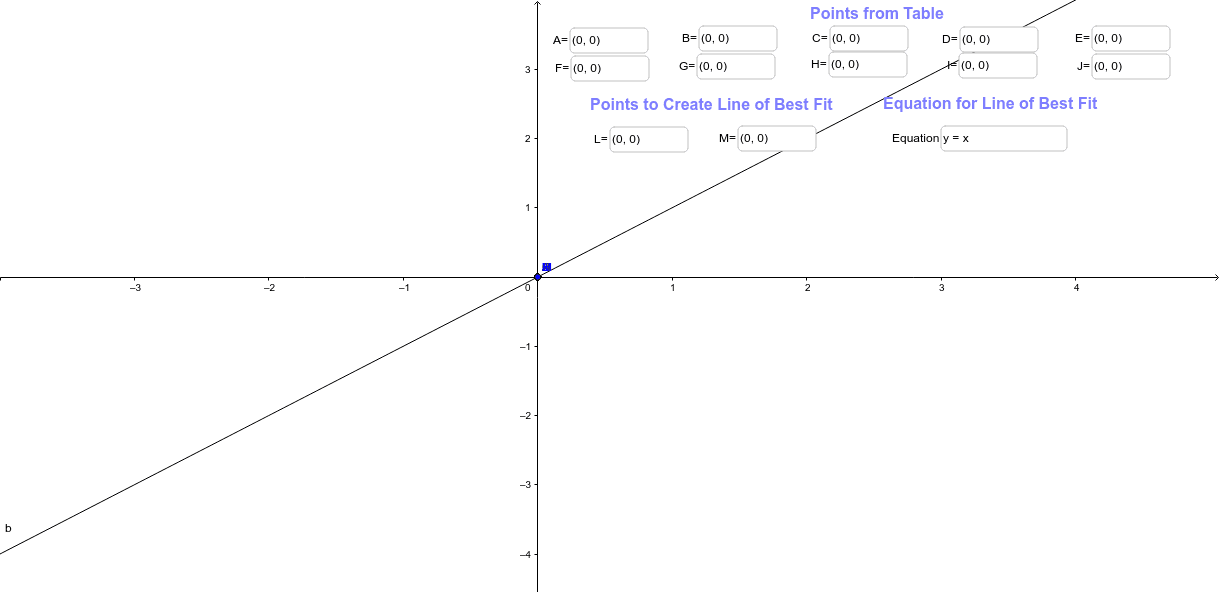
This example demonstrates how to create an X and Y scatter plot. Key mathematical concepts include coordinate geometry and graphing functions. Using GeoGebra commands, you can construct the scatter plot and analyze the relationship between data points. Suitable for middle school and above students to learn data visualization and statistical analysis.
GeoGebra Commands & Parameters
Textfield(A) → inputBox1Textfield(B) → inputBox2Textfield(C) → inputBox3Textfield(D) → inputBox4Textfield(E) → inputBox5Textfield(F) → inputBox6Textfield(G) → inputBox7Textfield(b) → inputBox10Textfield(H) → inputBox8Textfield(I) → inputBox9Textfield(J) → inputBox11Textfield(L) → inputBox12Textfield(M) → inputBox13