
Writing Linear Equations from Graphs
Loading the math board and drawing, please wait…
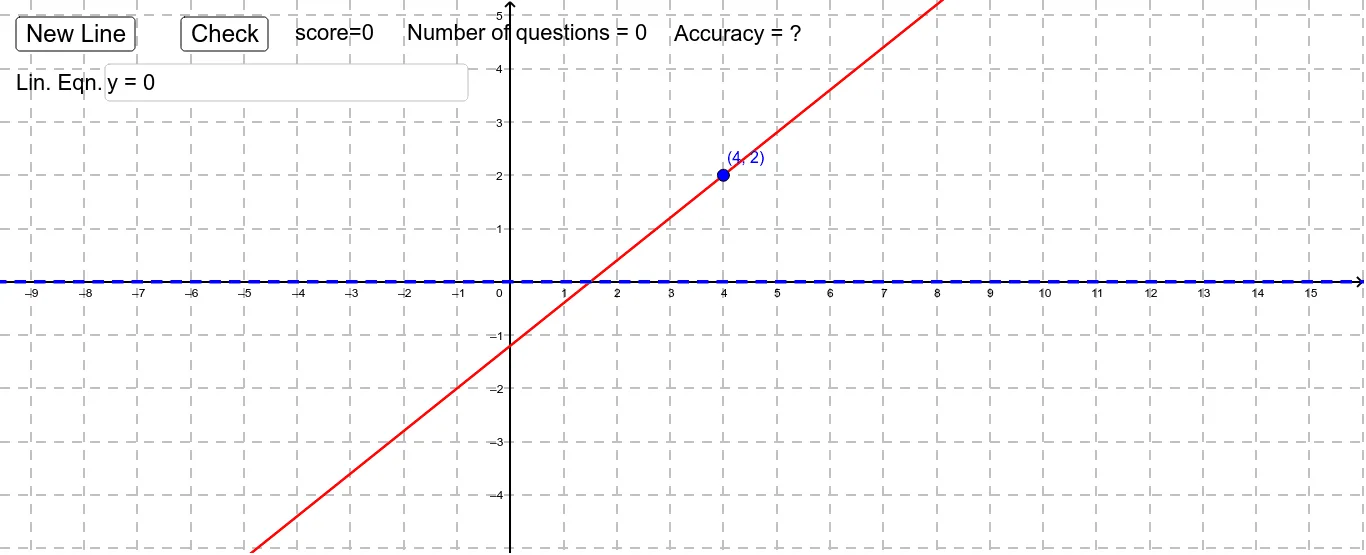
This example demonstrates how to write the equation of a linear function from its graph. Key math concepts include the standard form of a linear equation y=mx+b, slope m, and y-intercept b. It utilizes GeoGebra commands Random, RandomElement, Text, Textfield, and objects like score, x1, y1, P, m, a1, b, Incorrect, correct, text1, win, check, sameline, button1, button2, inputBox1, problems, accu, questions, accur. Suitable for middle school and above students learning linear functions and coordinate geometry.
GeoGebra Commands & Parameters
Random(-5, 5) → x1Random(-5, 5) → y1RandomElement({-3, -2, -2.5, -1.5, -1, -0.8, -0.75, -0.6, -0.5, -0.4, -0.25, -0.2, 0.2, 0.25, 0.4, 0.5, 0.6, 0.75, 0.8, 1, 1.5, 2, 2.5, 3}) → mText(("score=" * score)) → text1Textfield(b) → inputBox1Text(("Number of questions = " * problems)) → questionsText(("Accuracy = " * accu)) → accur
AI Drawing Prompt Reference
Draw the graph of a linear function showing the standard form y=mx+b, where m is a randomly generated slope and b is a randomly generated y-intercept. Mark the point (x1, y1) on the graph and display the current score, number of problems, and accuracy. Use a text box to input the value of b and check if the input is correct, updating the score and accuracy accordingly.
The prompt above was compiled from the original drawing commands and is for reference only.