
Write an Equation of a Line from a Graph
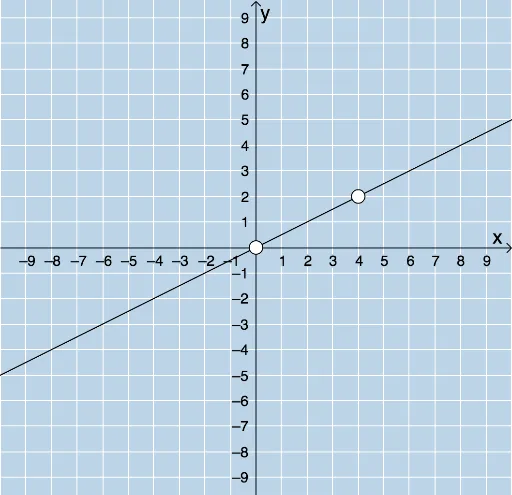
Loading the math board and drawing, please wait…
This example demonstrates how to write the equation of a line given its graph, where the y-intercept is an integer. It involves core math concepts like linear equations, slope, y-intercept, and coordinate geometry. Constructed using GeoGebra commands such as RandomElement, Random, Line, FractionText, Intersect, Segment, Polygon, and Textfield to generate practice problems and provide feedback. Suitable for middle school and above students to practice writing linear equations.
GeoGebra Commands & Parameters
RandomElement(klist) → krandRandom(-10, 10) → bRandomElement(xmovelist) → randxRandomElement(ymovelist) → randyLine(A, B) → fFractionText(Slope[f]) → text1Intersect(h, i) → CSegment(A, C) → jSegment(C, B) → kPolygon(A, C, B) → poly1, b_1, a_1, c_1Textfield(l) → InputBox1
AI Drawing Prompt Reference
Draw a line with an integer y-intercept and display its equation. First, randomly generate two points for the line and draw it. Then calculate the slope of the line and label it as a fraction. Next, find the intersection point of the line with the y-axis and connect this point to another point on the line. Finally, fill the triangle formed by the line, intersection point, and connecting line with color, and display the line's equation and slope fraction beside it.
The prompt above was compiled from the original drawing commands and is for reference only.