
Who Scores Better?
Loading the math board and drawing, please wait…
In collections
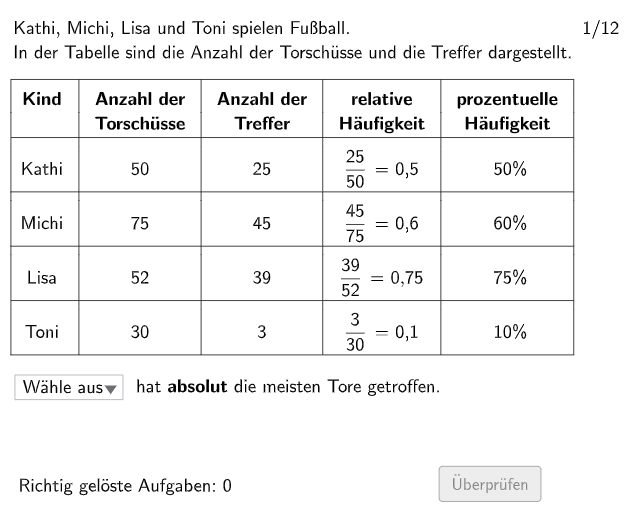
Wiederholung: absolute, relative & prozentuelle Häufigkeit
This example demonstrates probability & statistics through simulated shooting at a target, focusing on data distribution and comparison. Core concepts include probability, data interpretation, and analysis. GeoGebra commands like Mod, If, SelectedIndex, and Polygon are used for data simulation and graphical representation. Suitable for 5-6 grade students in probability & statistics and diagram interpretation exercises.
GeoGebra Commands & Parameters
Mod(count, 4) → zahlerBspIf(reihenfolge(count) ≟ 1, sol1(bspNum(count)), If[reihenfolge(count) ≟ 2, sol2(bspNum(count)), If[reihenfolge(count) ≟ 3, sol3(bspNum(count)), sol4(bspNum(count))]]) → nameNumSelectedIndex(names) → indexIf(count ≟ 1 ∨ count ≟ 8 ∨ count ≟ 11, correct1, If[count ≟ 2 ∨ count ≟ 5 ∨ count ≟ 10, correct2, If[count ≟ 3 ∨ count ≟ 6 ∨ count ≟ 9, correct3, correct4]]) → correctPolygon(PtopLeftCornerFeedback, PtopRightCornerFeedback, PbottomRightCornerFeedback, PbottomLeftCornerFeedback) → rectangleCorrect, ptopleftcornerfeedback, ptoprightcornerfeedback, pbottomrightcornerfeedback, pbottomleftcornerfeedbackPolygon(SelectedPoint, RightTopPoint, RightBottomPoint, LeftBottomPoint) → solQ1, selectedpoint, righttoppoint, rightbottompoint, leftbottompointPolygon(J, K, L, M) → hint4, j, k, l, mPolygon(J, I, N, M) → hint3, j_1, i, n, m_1Polygon(H, I, N, O) → hint2, h, i_1, n_1, oPolygon(G, H, O, Q) → hint1, g, h_1, o_1, qPolygon(SolP1, SolP3, SolP4, SolP2) → solQ2, solp1, solp3, solp4, solp2
AI Drawing Prompt Reference
Create a probability-and-comparison diagram based on simulated shooting at a target. First draw the target as a rectangle and mark its four corner points that will act as feedback corners. Then draw four score-solution quadrilaterals: one quadrilateral built from a chosen point together with its associated corner points, and three more quadrilaterals formed from their own corresponding corner points, all representing different answer regions. Finally, add four hint quadrilaterals, each enclosed by a distinct set of four corner points, arranged to guide a step-by-step reasoning about which score approach is better.
The prompt above was compiled from the original drawing commands and is for reference only.