
What Number is Missing?
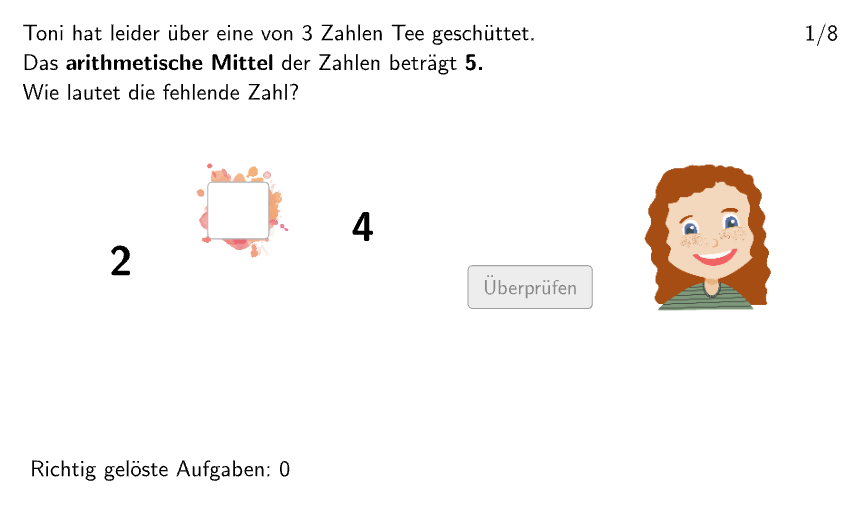
Loading the math board and drawing, please wait…
In collections
Mittelmaße
This example focuses on missing numbers in statistics, involving arithmetic mean, mode, and median. Using commands like If, Textfield, Polygon, Shuffle, etc., from the construction summary, it dynamically shows the impact of missing numbers on statistical characteristics. Suitable for students in grades 5-6.
GeoGebra Commands & Parameters
If(questionCount ≟ 1, 9, If[questionCount ≟ 2, 10, If[questionCount ≟ 3, 6, If[questionCount ≟ 4, 6, If[questionCount ≟ 5, 5, If[questionCount ≟ 6, 15, If[questionCount ≟ 7, 9, If[questionCount ≟ 8, 3]]]]]]]) → solTextfield(aInput) → InputBox1Textfield(bInput) → InputBox2Polygon(PtopLeftCornerFeedback, PtopRightCornerFeedback, PbottomRightCornerFeedback, PbottomLeftCornerFeedback) → rectangleCorrect, ptopleftcornerfeedback, ptoprightcornerfeedback, pbottomrightcornerfeedback, pbottomleftcornerfeedbackShuffle(Sequence[Random[0, 10], i, 1, 100]) → randomNosForX, {10, 10, 0, 7, 8, 0, 2, 10, 4, 1, 2, 5, 5, 6, 0, 5, 5, 4, 1, 3, 9, 0, 6, 8, 3, 2, 3, 1, 9, 4, 0, 4, 0, 10, 8, 3, 5, 1, 3, 7, 9, 3, 7, 9, 6, 3, 3, 10, 7, 4, 3, 0, 10, 3, 7, 3, 6, 9, 6, 3, 4, 3, 8, 4, 8, 6, 1, 4, 4, 3, 6, 1, 5, 5, 6, 9, 7, 2, 5, 8, 0, 1, 1, 4, 10, 0, 0, 8, 4, 1, 6, 8, 9, 4, 8, 9, 7, 7, 1, 1}Shuffle(Sequence[Random[0, 10], i, 1, 100]) → randomNosForY, {8, 6, 7, 9, 6, 4, 1, 5, 7, 2, 0, 5, 0, 10, 10, 5, 7, 1, 6, 10, 1, 1, 6, 5, 2, 4, 0, 9, 5, 6, 1, 7, 10, 9, 5, 7, 3, 4, 4, 7, 2, 4, 9, 1, 5, 9, 3, 5, 9, 2, 0, 2, 2, 10, 2, 1, 2, 6, 0, 9, 1, 2, 9, 5, 2, 10, 10, 1, 9, 7, 5, 4, 0, 3, 2, 8, 6, 6, 2, 8, 2, 8, 8, 0, 6, 5, 7, 7, 4, 2, 6, 8, 8, 10, 2, 9, 8, 6, 1, 2}Append(true, Sequence[If[randomNosForX(i) ≟ randomNosForX(i - 1), false, true], i, 2, 100]) → stayXAppend(true, Sequence[If[randomNosForY(i) ≟ randomNosForY(i - 1), false, true], i, 2, 100]) → stayYRemove(Sequence[If[stayX(i), randomNosForX(i), 0], i, 1, 100], Sequence[0, i, 1, 100]) → randomNosForXwithoutRepeatRemove(Sequence[If[stayY(i), randomNosForY(i), 0], i, 1, 100], Sequence[0, i, 1, 100]) → randomNosForYwithoutRepeatElement(randomNosForXwithoutRepeat, Mod[questionCount, Length[randomNosForXwithoutRepeat]] + 1) → numXwithoutRepeatElement(randomNosForYwithoutRepeat, Mod[questionCount, Length[randomNosForYwithoutRepeat]] + 1) → numYwithoutRepeatDefined(aInput) → fixedElement(randomNosForX, Mod[questionCount, 100] + 1) → numYIf(questionCount ≟ 1, 5, If[questionCount ≟ 2, 7, If[questionCount ≟ 3, 9, If[questionCount ≟ 4, 11, If[questionCount ≟ 5, 4, If[questionCount ≟ 6, 8, If[questionCount ≟ 7, 12, If[questionCount ≟ 8, 3]]]]]]]) → arithmM
AI Drawing Prompt Reference
Draw a statistical chart showing the impact of missing numbers on arithmetic mean, mode, and median. The chart includes a rectangle filled with random numbers between 0 and 10, a filtered sequence of unique numbers, and statistical measures (mean, mode, median). Construction order: generate random numbers, filter duplicates, compute statistics.
The prompt above was compiled from the original drawing commands and is for reference only.