
Water Wave Demonstration
Loading the math board and drawing, please wait…
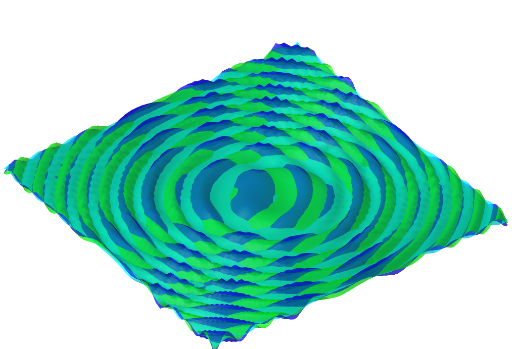
This example demonstrates wave propagation and interference on water surfaces. It involves core math concepts like trigonometric functions, function graphing, and coordinate geometry. Key GeoGebra commands/objects used include: b (wave source), speed (velocity), ca (amplitude), A, B (phase), f (frequency), cb (coordinate system), d (distance), c (constant). Suitable for high school physics and mathematics teaching to understand wave theory and function graphing.
GeoGebra Commands & Parameters
Numeric b(88.2)Numeric speed(0)Numeric ca(1.9)Point3d A(-7.821862335009796, 6.700550210760907, 0)Point3d B(6.158123473941482, -6.432163730981163, 0)f(x, y) = (ca * sin(((-b) * ℯ^((-(((x - x(A))^(2) + (y - y(A))^(2)) / b^(2))))))) + (ca * sin(((-b) * ℯ^((-(((x - x(B))^(2) + (y - y(B))^(2)) / b^(2)))))))Numeric cb(1)d(x, y) = (cb * sin(((-b) * ℯ^((-(((x - x(B))^(2) + (y - y(B))^(2)) / b^(2)))))))c(x, y) = (ca * sin(((-b) * ℯ^((-(((x - x(A))^(2) + (y - y(A))^(2)) / b^(2)))))))
AI Drawing Prompt Reference
Draw a water wave demonstration showing wave peaks and troughs from two sources. The peaks and troughs form through interference. The graph includes peaks, troughs, and interference areas, illustrating wave propagation and superposition.
The prompt above was compiled from the original drawing commands and is for reference only.