
Voronoi Diagrams - Toxic Waste Problem
Loading the math board and drawing, please wait…
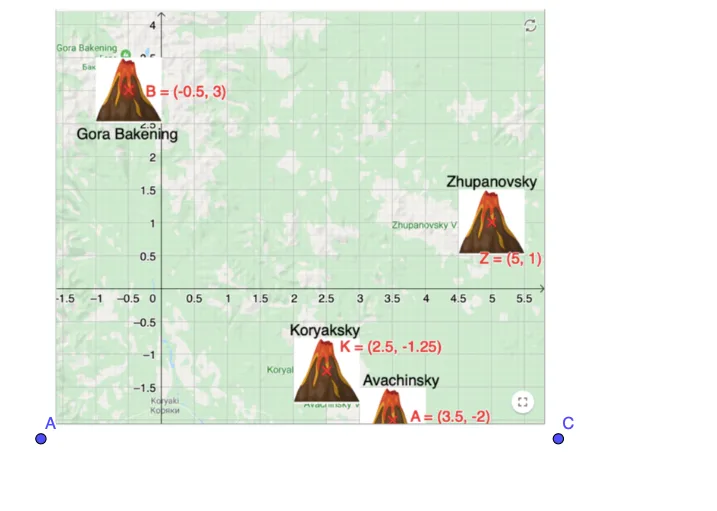
This example demonstrates the toxic waste problem using Voronoi diagrams to show the safe area division around multiple pollution sources. Key mathematical concepts include Voronoi diagrams, geometric construction, and coordinate geometry. GeoGebra commands used include creating objects B, A, and C.
GeoGebra Commands & Parameters
Point B(4.095999999999999, -2.686000000000001)Point A(-9.284, -7.386)Point C(0.7816, -7.386)
AI Drawing Prompt Reference
Draw a Voronoi diagram to show the safe area division around three pollution sources. The key objects are three points: point B at (4.096, -2.686), point A at (-9.284, -7.386), and point C at (0.7816, -7.386). Construct the Voronoi diagram by placing these points first, then drawing the diagram to display the area divisions. The order of construction is to place the points and then create the diagram.
The prompt above was compiled from the original drawing commands and is for reference only.