
Voronoi Diagram and Delaunay Triangulation
Loading the math board and drawing, please wait…
In collections
El dominio del Tiempo (cinemática intuitiva)
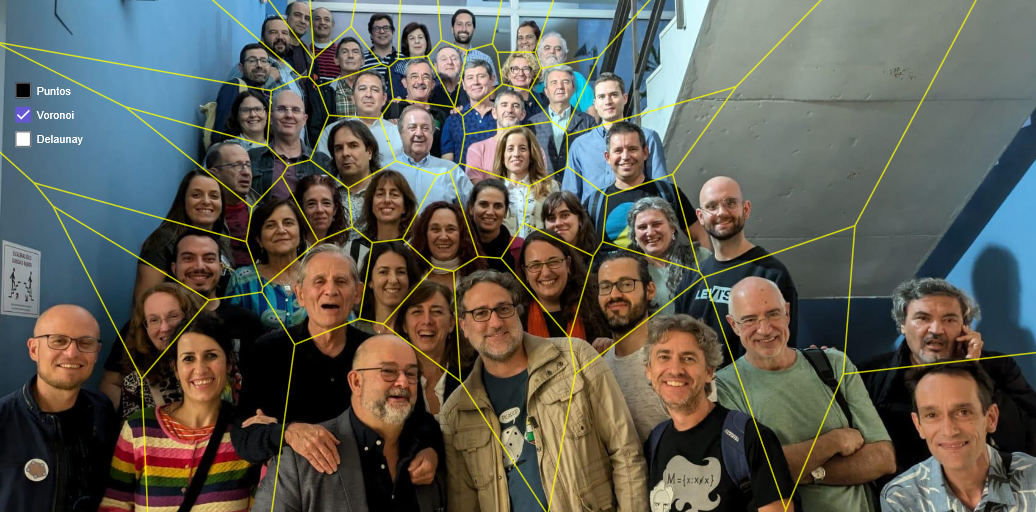
This example demonstrates Voronoi diagrams and Delaunay triangulation. By constructing multiple points, Voronoi diagrams and Delaunay triangulation are generated. The commands used include Voronoi and DelaunayTriangulation. Suitable for high school and above students to learn geometric construction and spatial division.
GeoGebra Commands & Parameters
Voronoi(CellRange(A1,A49,"point")) → voronoiDelauneyTriangulation(CellRange(A1,A49,"point")) → delaunay
AI Drawing Prompt Reference
Draw a diagram showing multiple random points along with their generated Voronoi diagram and Delauney triangulation. Start by creating several points, then generate a Voronoi diagram based on these points to illustrate the distance relationships to the nearest neighbors, followed by creating a Delauney triangulation to show how the points connect into non-overlapping triangular regions. Finally, overlay both diagrams to display the spatial partitioning and geometric construction relationships.
The prompt above was compiled from the original drawing commands and is for reference only.