
Volume Unit Conversion Practice
Loading the math board and drawing, please wait…
In collections
Wiederholung: Flächen- und Raummaße
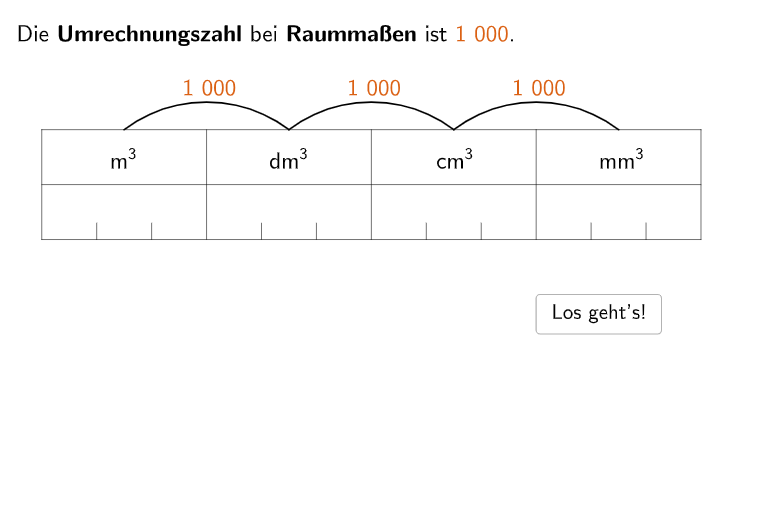
This example demonstrates the conversion relationships between different volume units (liters, cubic decimeters, cubic centimeters, etc.). Key math concepts include volume unit conversion, capacity unit transformation, and decimal calculations. GeoGebra commands/objects used in the construction summary include Midpoint, Segment, Point, CircleArc, Polygon, Intersect, Textfield, and If. It is suitable for 5th-6th grade students learning about volume unit conversion and practical applications.
GeoGebra Commands & Parameters
Midpoint(A_2, D_1) → D_2Midpoint(D_1, E_1) → P_1Midpoint(P_1, E_1) → J_2Segment(K, O) → fSegment(O, Q) → gSegment(Q, R) → hSegment(R, K) → iSegment(L, U) → jSegment(M, T) → kSegment(N, S) → lPoint(i) → VSegment(V, P) → mSegment((-3, 3), (-3, 3.3)) → nSegment((-2, 3), (-2, 3.3)) → pSegment((0, 3), (0, 3.3)) → qSegment((1, 3), (1, 3.3)) → rSegment((3, 3), (3, 3.3)) → sSegment((4, 3), (4, 3.3)) → tSegment((6, 3), (6, 3.3)) → aSegment((7, 3), (7, 3.3)) → bMidpoint(K, L) → WMidpoint(L, M) → ZMidpoint(M, N) → A_1Midpoint(N, O) → B_1CircleArc(U, Z, W) → cCircleArc(T, A_1, Z) → dCircleArc(S, B_1, A_1) → eSegment(H_1, D_1) → f_1Segment(E_1, G_1) → h_1Segment(C_1, F_1) → i_1Polygon(I_1, M, E_1, D_1) → q1, j_1, m_1, e_1, d_1Segment(L_1, S) → l_1Segment(K_1, N_1) → n_1Segment(J_1, O_1) → p_1Segment(F_1, M_1) → q_1Midpoint(E_1, J_1) → Q_1Midpoint(J_1, K_1) → R_1Midpoint(K_1, L_1) → S_1Intersect(p_1, q_1) → T_1Intersect(n_1, q_1) → U_1CircleArc(W_1, Q_1, R_1) → r_1CircleArc(Z_1, R_1, S_1) → s_1Segment(A_2, U) → a_1Segment(B_2, C_1) → b_1Polygon(F_2, N, L_1, K_1) → q2, g_2, n_2, h_2, i_2Textfield(aInput) → InputBox1If(move ≟ 5, G_2, If[move ≟ 6, H_2, If[move ≟ 7, I_2]]) → PositionInputBoxCircleArc(V_1, J_2, Q_1) → c_1CircleArc(E_2, D_2, P_1) → c_2
AI Drawing Prompt Reference
Draw an example diagram for volume unit conversion practice, including conversion relationships between various volume units (liters, cubic centimeters, etc.). The diagram should contain a circular volume unit conversion chart with multiple arcs representing the conversion relationships between different volume units. The chart should be surrounded by a circular background with a scale on it, marked with labels indicating the values of different volume units. The arcs in the chart and the labels on the scale should be clearly labeled with the names and values of the volume units.
The prompt above was compiled from the original drawing commands and is for reference only.