
Visualizing x^n When n Is Not an Integer: From Integer to Real Exponents
Loading the math board and drawing, please wait…
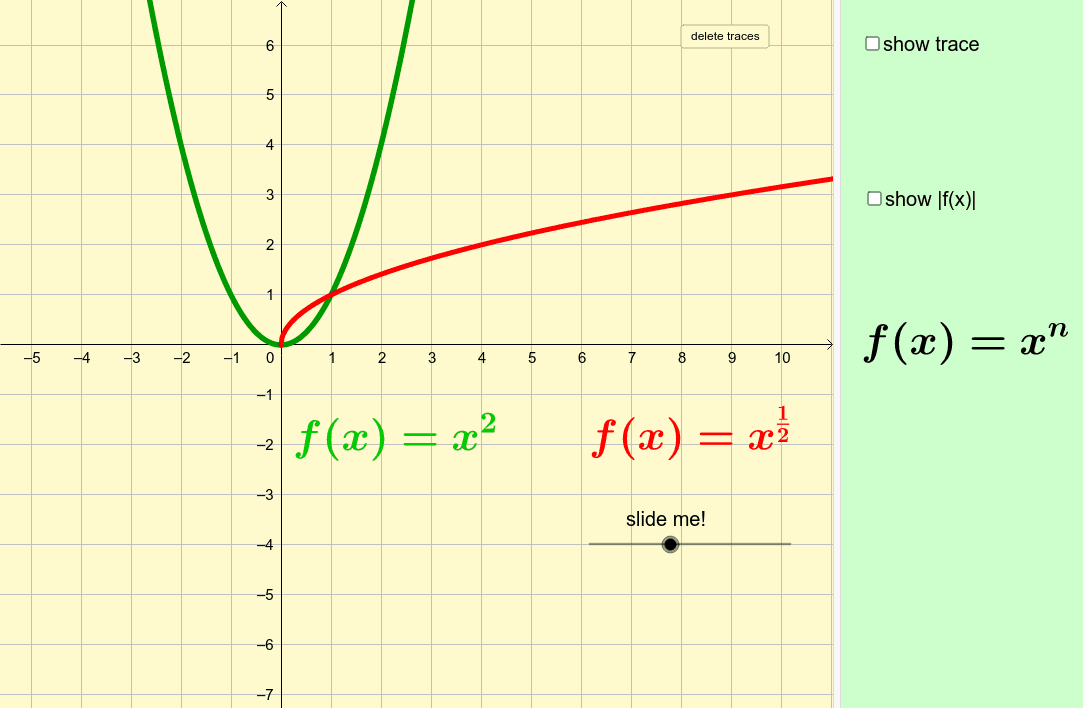
This GeoGebra example demonstrates the behavior of the function y=x^n when the exponent n is a non-integer (fractional or irrational). Key mathematical concepts covered include: the relationship between fractional exponents and radicals (x^(m/n)=ⁿ√(x^m)), domain and range of real exponent functions, and the discontinuities that appear when n is not an integer. Construction details: uses the function command f(x)=x^n to plot curves, employs a slider object 'n' to control exponent changes continuously, includes trace functionality (ftrace, gtrace) to visualize curve evolution, and incorporates buttons and text elements for interactive control. Suitable for high school mathematics units on exponents and logarithms, or university-level introduction to real exponent functions. Also valuable for competition math topics on conversion between radicals and exponents.
GeoGebra Commands & Parameters
Numeric n(2.0)f(x) = x^(n)Point A(NaN, NaN, NaN)Boolean a(false)g(x) = abs(f(x))ftrace(x) = x^(n)gtrace(x) = x^(n)Boolean b(false)Boolean c(true)fi(x) = x^(1 / n)figi(x) = abs(x^(1 / n))
AI Drawing Prompt Reference
Plot the function y=x^n with the exponent n changing continuously via a slider, showing the transition from integer to real exponents. Include the original function curve, its absolute value curve, and their traces to visualize the dynamic evolution of the curves as the exponent changes. Also plot the nth root and its absolute value, revealing the relationship between exponents and radicals, with key points and text annotations.
The prompt above was compiled from the original drawing commands and is for reference only.