
Visualizing Volumes by Known Cross Section
Loading the math board and drawing, please wait…
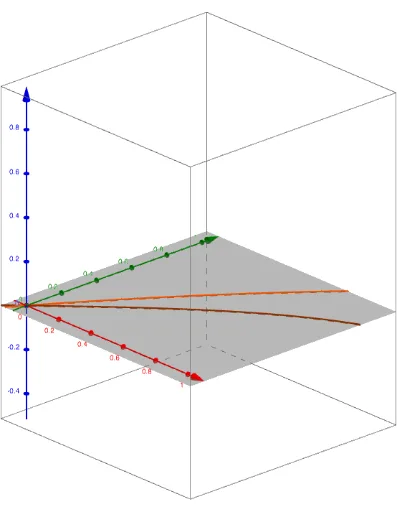
This example demonstrates the visualization of volumes using known cross sections. Key mathematical concepts include solid geometry and integration. Using GeoGebra commands such as X, n, e, h, i, f, p, various cross sections of solid figures can be constructed and their volumes calculated. Suitable for high school and above students or teachers.
GeoGebra Commands & Parameters
Numeric X(1)Numeric n(33)Boolean e(false)Boolean h(false)Boolean i(true)f(x) = ((π * x)) / 2 - x^(2) / 4p(x) = sin(x)
AI Drawing Prompt Reference
Visualize the volume of a solid by plotting known cross sections. Draw two functions, f(x) = (π * x) / 2 - x^2 / 4 and p(x) = sin(x), over the interval from 0 to 1. These functions represent the cross sections of a solid. The area between these curves is shaded to illustrate the volume, demonstrating the relationship between cross sections and the overall solid geometry.
The prompt above was compiled from the original drawing commands and is for reference only.