
Visualizing the Definition of Scientific Notation with Geogebra Construction
Loading the math board and drawing, please wait…
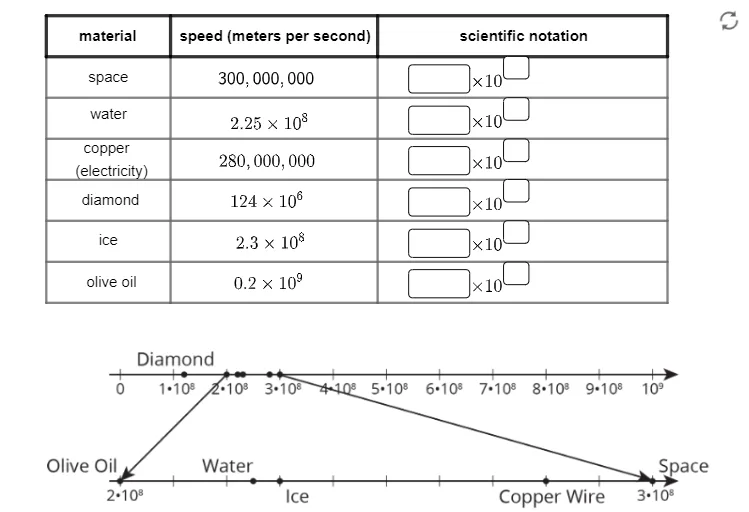
This example demonstrates the definition of scientific notation by using a GeoGebra scene with segments, intersection points, and carefully placed text labels to visualize the form “significand × 10^exponent.” The key mathematics concepts are scientific notation as a normalized representation, the role of powers of 10 in encoding magnitude (order of magnitude), and how separating the coefficient and the exponent clarifies very large or very small numbers. Construction highlights include creating guiding segments (Segment), defining anchor positions with points (Point), using intersections (Intersect) to locate where labels should attach, and entering formulas/values with text fields (Textfield). The setup uses multiple geometric/annotation objects (e.g., segment endpoints and text/graphics placeholders such as pic1/pic2/pic3 and numerous labeled points like A, B, A1…A7, B1…B7) to present the coefficient–exponent relationship visually. Suitable for middle and high school instruction, concept introduction, and classroom activities focused on numeric notation and magnitude reasoning.
GeoGebra Commands & Parameters
Segment(G, H) → fSegment(H, I) → gSegment(I, J) → hSegment(J, G) → iSegment(I, K) → jSegment(K, L) → kSegment(L, J) → lSegment(K, M) → mSegment(M, N) → nSegment(N, L) → pPoint(f) → OPoint(n) → PSegment(O, P) → qPoint(n) → QPoint(f) → RSegment(Q, R) → rPoint(f) → SPoint(n) → TSegment(S, T) → sPoint(n) → UPoint(f) → VSegment(U, V) → tPoint(n) → ZSegment(W, Z) → aIntersect(f, g) → A_1Segment(A_1, B_1) → bSegment(B_1, C_1) → cIntersect(m, n) → D_1Segment(C_1, D_1) → dPoint(g) → E_1Point(c) → F_1Segment(E_1, F_1) → eIntersect(j, k) → G_1Segment(G_1, H_1) → f_1Textfield() → InputBox1Textfield() → InputBox2Textfield() → InputBox3Textfield() → InputBox4Textfield() → InputBox5Textfield() → InputBox6Textfield() → InputBox7Textfield() → InputBox8Textfield() → InputBox9Textfield() → InputBox10Textfield() → InputBox11Textfield() → InputBox12
AI Drawing Prompt Reference
Please draw a geometric figure composed of line segments, points, and intersection points. The figure should include multiple line segments connecting points and intersection points of lines. Also include text boxes for labeling. The overall figure should illustrate the concept of scientific notation, where a number is represented as a coefficient multiplied by a power of 10. The figure should clearly show the relationship between the coefficient and the exponent.
The prompt above was compiled from the original drawing commands and is for reference only.