
Visualizing the Arithmetic Sequence
Loading the math board and drawing, please wait…
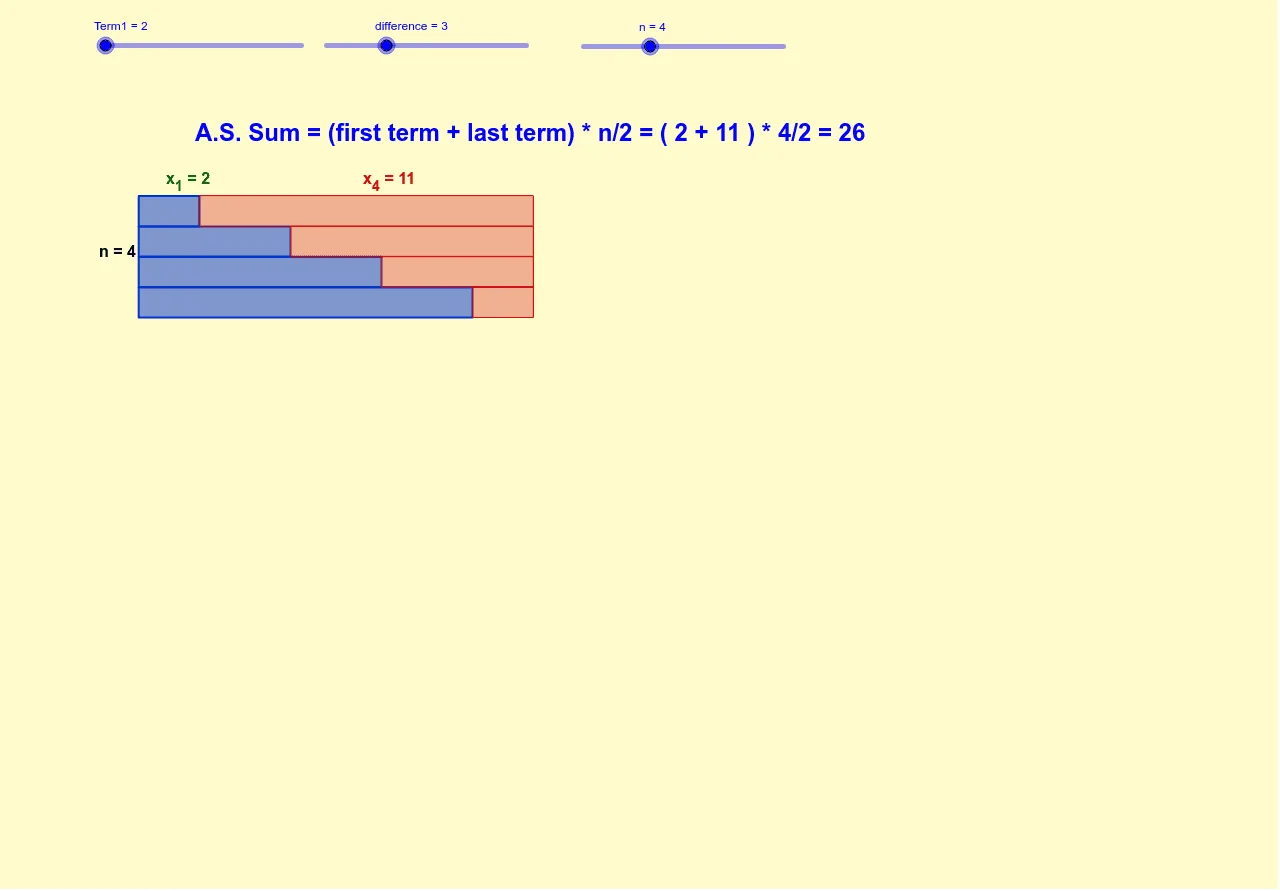
This example demonstrates the visualization of an arithmetic sequence. It involves the core mathematical concepts of the definition and properties of an arithmetic sequence. Using GeoGebra commands Sequence and Text, the example dynamically shows each term and its sum. Suitable for students in middle school and above to learn about arithmetic sequences.
GeoGebra Commands & Parameters
Sequence(Polygon[(0, (-k)), (0, (-k) - 1), (Term1 + (k * difference), (-k) - 1), (Term1 + (k * difference), (-k))], k, 0, n - 1) → list1Sequence(Polygon[(Term1 + (k * difference), (-k)), (Term1 + (k * difference), (-k) - 1), ((2 * Term1) + (n * difference) - difference, (-k) - 1), ((2 * Term1) + (n * difference) - difference, (-k))], k, 0, n - 1) → list2Text(("n = " * n), ((-1.3), ((-n)) / 2)) → text1Text(("x_1 = " * Term1), (Term1 / 2 - 0.1, 0.4)) → TEXT1Text(((("x_" * n) * " = ") * (Term1 + ((n - 1) * difference))), (((3 * Term1) + ((n - 1) * difference)) / 2 - 0.1, 0.4)) → TEXT2Text(((((((("A.S. Sum = (first term + last term) * n/2 = ( " * Term1) * " + ") * (Term1 + ((n - 1) * difference))) * " ) * ") * n) * "/2 = ") * (((2 * n) * Term1) + (((n - 1) * difference) * n)) / 2), (Term1 / 2 - 0.1, 5.1)) → text6
AI Drawing Prompt Reference
Visualize an arithmetic sequence by drawing polygons for each term, showing their positions shifting horizontally as the sequence progresses. Label the term number n, the first term x1, and the nth term below the polygons. Calculate and display the sum of the sequence above, using the formula (first term + last term) * n/2.
The prompt above was compiled from the original drawing commands and is for reference only.