
Visualizing Periodicity of Sine Function
Loading the math board and drawing, please wait…
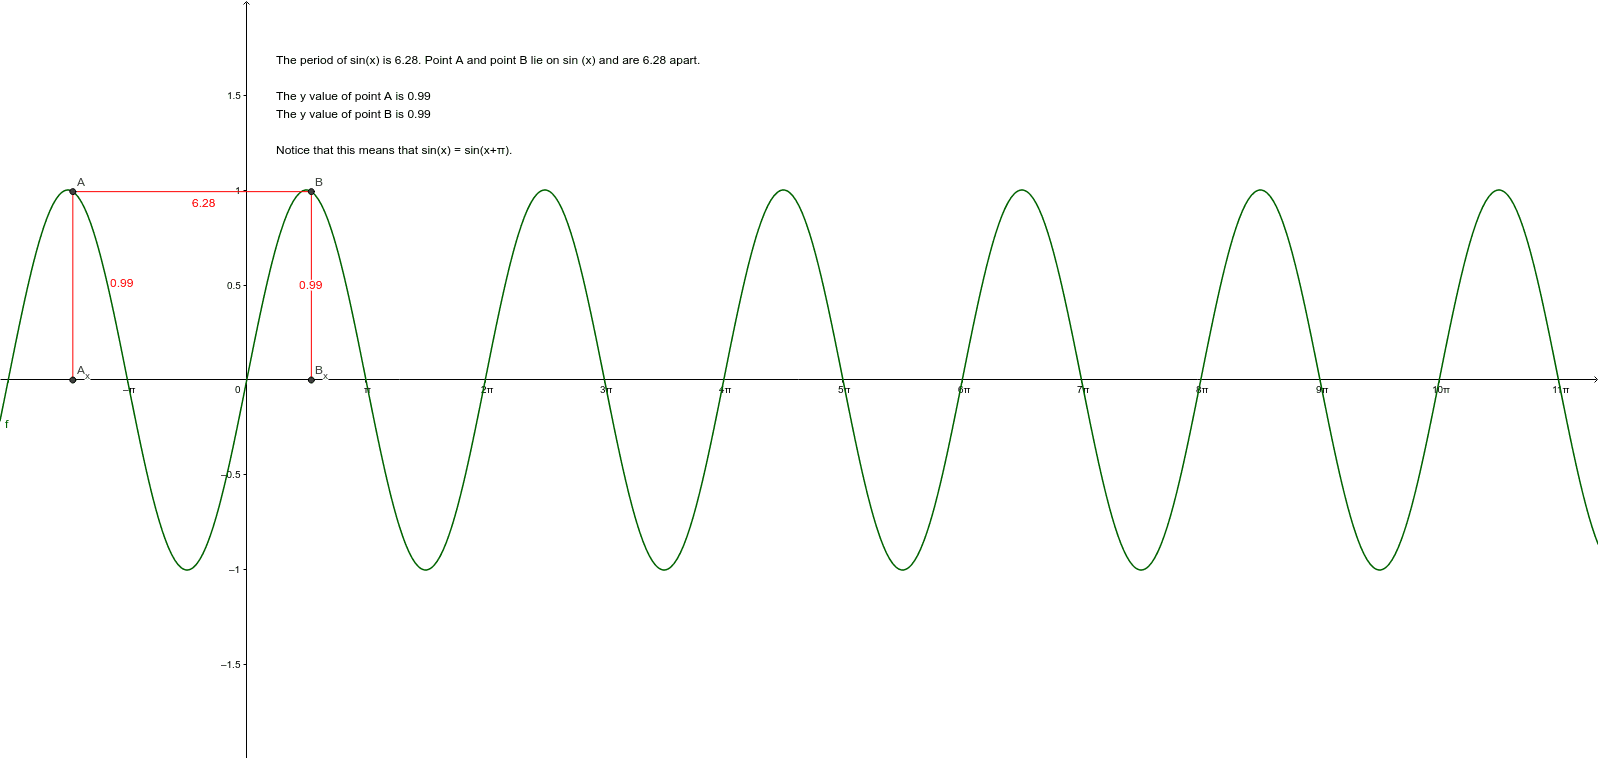
①This GeoGebra example dynamically illustrates the periodic nature of the sine function sin(x), showing how its values repeat at regular intervals. ②Core mathematical concepts include trigonometric periodicity, the relationship between the unit circle and the sine curve, and translational symmetry of function graphs. ③Construction highlights: using the Segment command, the example involves objects such as f (function), a (angle or parameter), points A and B, segment b, x-coordinates A_x and B_x, auxiliary objects c and d, and a text label text1, likely with a slider to animate the parameter and reveal the repeating pattern. ④Suitable for high school and early college students learning trigonometric properties, and useful for teachers demonstrating periodicity or for students exploring phase shifts and period changes interactively.
GeoGebra Commands & Parameters
Segment(A, B) → bSegment(A_x, A) → cSegment(B_x, B) → d