
Visualizing Multiplication with Variables
Loading the math board and drawing, please wait…
In collections
Variables, Equations
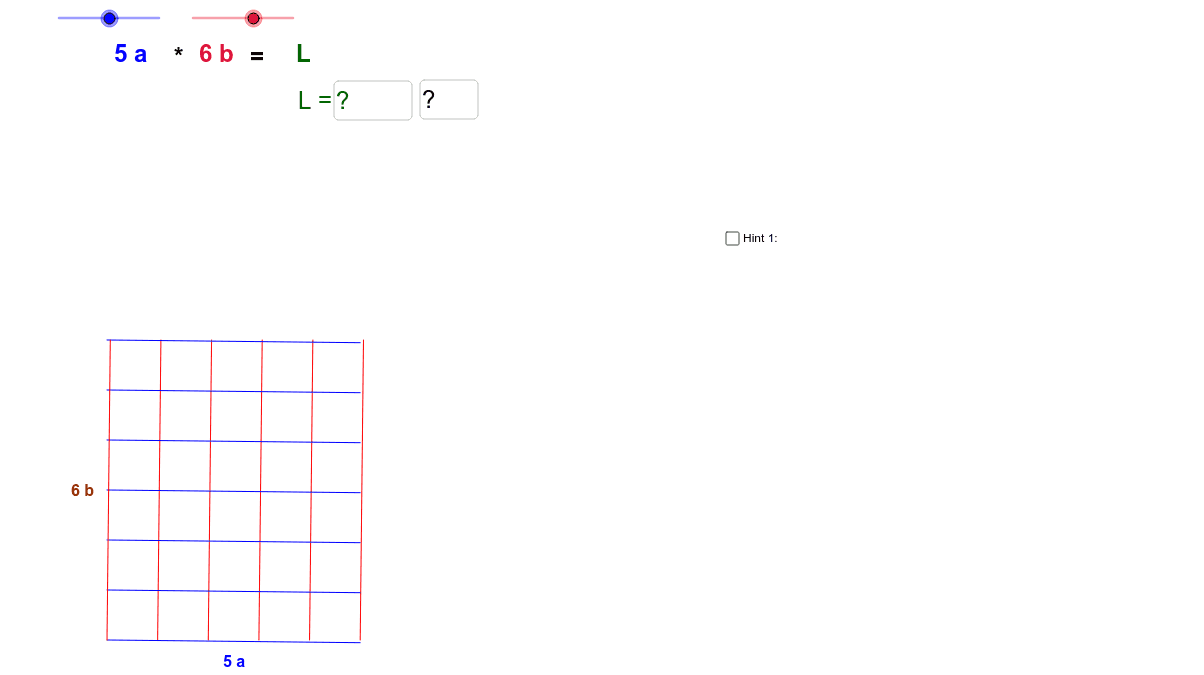
This example visually demonstrates multiplication operations. Different problems can be created using sliders, providing an intuitive understanding of the geometric representation of variable multiplication. The core math concepts involved include algebraic operations and geometric interpretation. The construction utilizes GeoGebra commands and objects such as Textfield, Point, Segment, OrthogonalLine, Circle, Intersect, Line, Sequence, and Midpoint to build a visual model of multiplication. It is suitable for middle school mathematics education, helping students grasp the geometric significance of variable operations.
GeoGebra Commands & Parameters
Textfield(i) → Textfeld1Point(Circle[A, k]) → BSegment(A, B) → aOrthogonalLine(A, a) → bOrthogonalLine(B, a) → cCircle(A, j) → dIntersect(d, b) → T_1, DLine(D, a) → eIntersect(e, c) → CSequence(Segment[A + i * (1, 0), D + i * (1, 0)], i, 1, k) → Liste1Sequence(Segment[A + i * (0, 1), B + i * (0, 1)], i, 1, j) → Liste2Segment(A, D) → fTextfield(studText) → inputBox1Midpoint(A, B) → EMidpoint(A, D) → FMidpoint(D, B) → G
AI Drawing Prompt Reference
Create a geometric visualization of multiplication using sliders to demonstrate variable multiplication. The construction includes points, perpendicular line segments, and circles intersecting at specific points. Connect these points with line segments to form a model representing multiplication. Label the key points and segments, and display the multiplication result.
The prompt above was compiled from the original drawing commands and is for reference only.