
Visualizing Limits: Left and Right Limits with Function Graphs
Loading the math board and drawing, please wait…
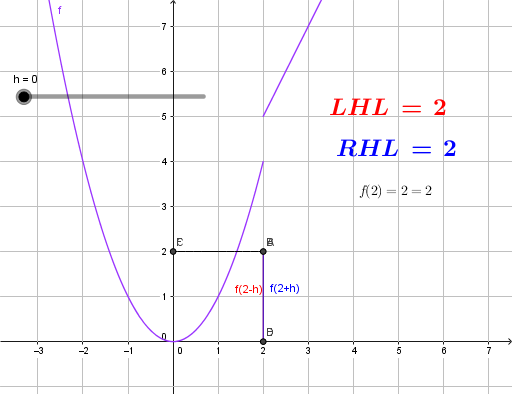
① This example dynamically demonstrates the concept of left-hand and right-hand limits at a point, visually showing how function values approach a target as the independent variable tends to that point. ② Core mathematical concepts include limits (LHL and RHL), continuity, trigonometric functions, hyperbolas, and 2D vectors in geometric constructions. ③ Construction details: Uses GeoGebra commands OrthogonalLine, Intersect, and Segment to build auxiliary lines, with LaTeX text objects (text1, text2, text3) labeling limit values; objects include functions f and h, points A, B, C, D, E, F, lines g, i, j, k, segment l, and point p, where the positions of LHL and RHL points illustrate the limiting behavior. ④ Suitable for high school to early college students, this serves as an interactive tool for grasping the intuitive definition of limits, distinguishing left vs. right limits, and analyzing discontinuities, ideal for introductory calculus instruction.
GeoGebra Commands & Parameters
OrthogonalLine(A, yAxis) → gOrthogonalLine(A, xAxis) → iOrthogonalLine(B, yAxis) → jOrthogonalLine(B, xAxis) → kIntersect(g, yAxis) → CIntersect(i, xAxis) → DIntersect(k, xAxis) → EIntersect(j, yAxis) → FSegment(C, A) → lSegment(A, D) → LHLSegment(B, E) → RHLSegment(B, F) → pLaTeX(LHL, true, true) → text1LaTeX(RHL, true, true) → text2
AI Drawing Prompt Reference
Draw a coordinate plane with a trigonometric curve and a hyperbola. Place two points on the x-axis, and through each point draw perpendicular lines to both axes, creating two sets of auxiliary lines. The intersections of these lines with the axes form rectangular frames. Connect the intersection points to nearby points on the curve to create segments representing the left-hand and right-hand limits. Label the limit values with text near the segments. Show how function values approach a target as the variable tends to the point, highlighting the difference between left and right limits and the discontinuity.
The prompt above was compiled from the original drawing commands and is for reference only.