
Visualizing First and Second Derivatives of a Function
Loading the math board and drawing, please wait…
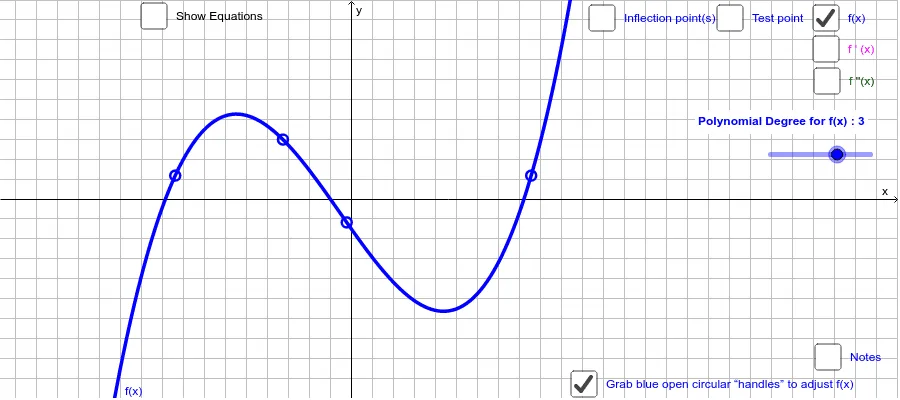
This GeoGebra applet dynamically illustrates the relationships among a function, its first derivative, and its second derivative, enabling learners to intuitively grasp how derivatives govern function analysis. Core mathematical concepts include the geometric meaning of the derivative as the slope of the tangent line, how the first derivative determines monotonicity (increasing/decreasing intervals), how the second derivative reveals concavity and inflection points, and the role of derivatives in locating extrema. The construction uses the Derivative command to generate f' and f'', Point, Tangent, and Segment commands to draw tangent lines and their segments on the original curve, and the Extremum command to mark local maxima and minima. Conditional If commands and text objects (e.g., textINC, textDEC, textNo) automatically label intervals of increase, decrease, and inflection points. Sliders (a, b, c, etc.) allow users to modify the function and observe corresponding changes in both derivatives. This applet is suitable for high school and early college calculus courses, particularly for introducing derivative concepts, analyzing function graphs, and exploring optimization and inflection problems through interactive visualization.
GeoGebra Commands & Parameters
If(deg ≟ 4, Polynomial[{A_1, A_2, A_3, A_4, A_5}], If[deg ≟ 3, Polynomial[{A_1, A_2, A_3, A_4}], If[deg ≟ 2, Polynomial[{A_1, A_2, A_3}], If[deg ≟ 1, Polynomial[{A_1, A_2}], Polynomial[{A_1, A_2}]]]]) → fDerivative(f) → f'Derivative(f') → f''Point(f) → KPoint(f') → MTangent(K, f) → aPoint(a) → EPoint(a) → FSegment(E, F) → bTangent(M, f') → cPoint(c) → GPoint(c) → HSegment(G, H) → dExtremum(f') → O_1, O_2Extremum(f'') → A
AI Drawing Prompt Reference
Create an interactive graph showing a function defined by a polynomial of degree 1 to 4, adjustable via sliders and draggable points. The first and second derivatives of this function are automatically plotted. On the original function curve, place a movable point with a tangent line at that point, and draw a segment along the tangent between two points on it. Similarly, on the first derivative curve, place a movable point with its tangent line and a segment. Mark the extrema of the first derivative (which correspond to local maxima and minima of the original function) and the zeros of the second derivative (inflection points). Automatically label intervals where the function is increasing or decreasing based on the sign of the first derivative, and label inflection points. The graph visually connects the function, its derivatives, tangent lines, extrema, and inflection points.
The prompt above was compiled from the original drawing commands and is for reference only.