
Visualizing Complex Solutions to Quadratic Functions
Loading the math board and drawing, please wait…
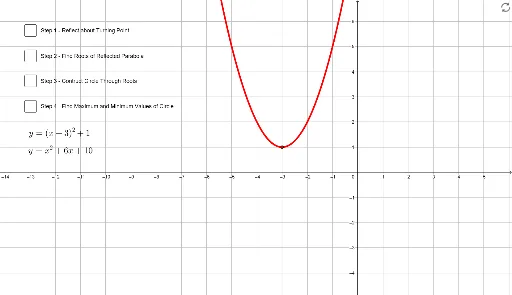
This example demonstrates the complex solutions of quadratic functions. It involves core concepts of complex numbers, functions, and quadratic functions. Using GeoGebra commands such as Mirror, Root, Midpoint, etc., it provides an intuitive visualization of the quadratic function's graph and its complex solutions. Suitable for high school mathematics education and learning.
GeoGebra Commands & Parameters
Mirror(f, Extremum[f]) → f_1Root(f_1) → A, BMidpoint(A, B) → CCircle(C, B) → cOrthogonalLine(C, xAxis) → gIntersect(c, g, 2) → DIntersect(c, g, 1) → EPoint(f) → FExtremum(f) → G
AI Drawing Prompt Reference
Draw the graph of a quadratic function and its complex solutions. First, find the vertex of the function, then mirror the function graph over the vertex. Next, locate the roots of the mirrored image and calculate the midpoint of these two roots. Draw a circle centered at the midpoint with a radius equal to the distance to the roots. Then, draw a line through the midpoint that is perpendicular to the x-axis, intersecting the circle at two points. Finally, mark the vertex on the original function graph and connect the vertex to the two intersection points to complete the illustration.
The prompt above was compiled from the original drawing commands and is for reference only.