
Visualizing Arithmetic Sum
Loading the math board and drawing, please wait…
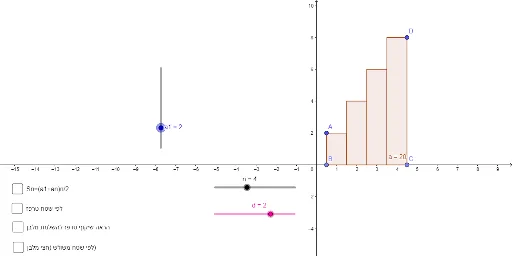
This example demonstrates the geometric interpretation of the arithmetic series sum formula, visually representing the summation process through dynamic polygons and bar charts. Key math concepts include arithmetic sequences, sum formulas, polygon area, bar chart representation, and analytical geometry. It utilizes GeoGebra commands like Polygon, Area, BarChart, and TextToUnicode, along with objects such as n (number of terms), a1 (first term), and d (common difference). Suitable for high school mathematics education, helping students understand the connection between sequence summation and geometric shapes, enhancing logical thinking and visualization skills.
GeoGebra Commands & Parameters
Polygon((0.5, 0), (n + 0.5, r(n) + a1), (n + 0.5, 0)) → poly1, f, h, iArea(poly1) → bBarChart(1…n, r(s), 1) → aPolygon(A, B, C, D) → q1, a_1, b_1, a_nn, d_1Area(q1) → ePolygon(A, D, (n + 0.5, y(D) + y(A)), (0.5, y(D) + y(A))) → q3, a_3, a_11, nn, a_nTextToUnicode("(a1+an)n/2") → l1
AI Drawing Prompt Reference
Create a dynamic visualization showing the geometric interpretation of the arithmetic series sum formula. Include a polygon from (0.5, 0) to (n+0.5, r(n)+a1) whose area represents the partial sum, and a bar chart for terms 1 to n with heights matching their values. Construct two additional polygons: one forming a rectangle with the first and last terms, and another with the average height, to illustrate the sum formula geometrically.
The prompt above was compiled from the original drawing commands and is for reference only.