
Visualizing a System of Linear Equations by ehock
Loading the math board and drawing, please wait…
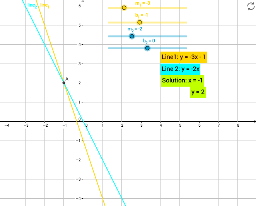
This example dynamically demonstrates the intersection point of two lines to visually show the solution set of a system of linear equations. Core math concepts include linear equations, coordinate geometry, and intersection calculations. Key GeoGebra commands used are Intersect for calculating the intersection point A of line_1 and line_2, along with dynamic display of coordinates (text3, text4), and sliders (m_1, b_1, m_2, b_2) to control line parameters. Suitable for high school mathematics teaching to understand the geometric meaning and solution methods of linear equation systems.
GeoGebra Commands & Parameters
Intersect(line_1, line_2) → A