
Visualizing Triangle Inequalities by ehock
Loading the math board and drawing, please wait…
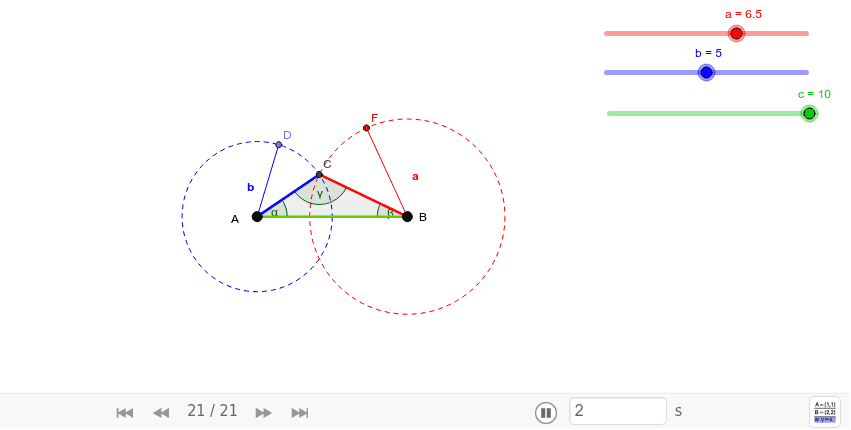
This example dynamically demonstrates the triangle inequality by visualizing the relationship between the sides of a triangle. It involves core mathematical concepts such as triangle inequalities, coordinate geometry, and geometric constructions. Key GeoGebra commands used include Point, Segment, Circle, Midpoint, Intersect, Polygon, and Angle. Suitable for high school mathematics teaching or self-study to understand basic triangle properties and inequality applications.
GeoGebra Commands & Parameters
Point(Circle[A, c]) → BSegment(A, B) → f_1Circle(B, a) → fCircle(A, b) → ePoint(e) → DSegment(D, A) → gMidpoint(D, A) → EPoint(f) → FSegment(F, B) → hMidpoint(F, B) → GIntersect(f, e, 1) → CPolygon(A, B, C) → poly1, c_1, a_1, b_1Angle(B, A, C) → αAngle(C, B, A) → βAngle(A, C, B) → γ