
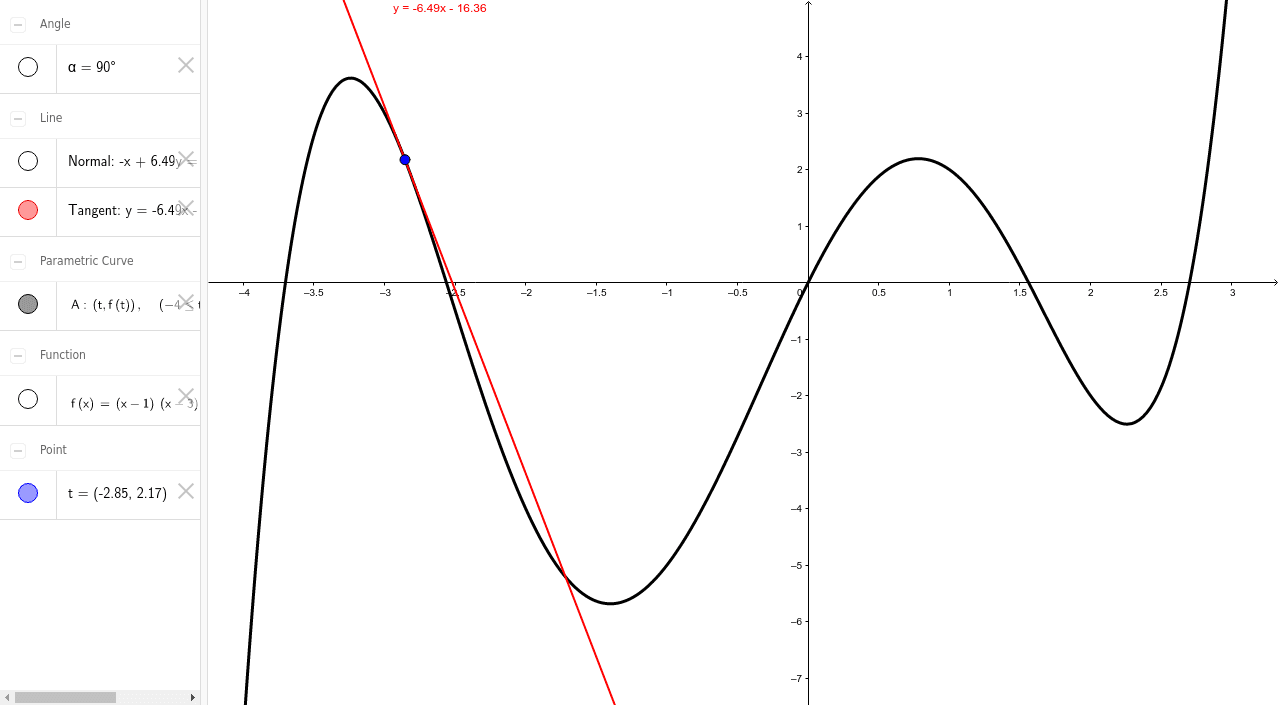
Visualization of Tangent Line Slope
Loading the math board and drawing, please wait…
This example visualizes the changing slope of the tangent line to a curve at different input values. Key mathematical concepts include derivatives and tangents. It uses GeoGebra commands such as CurveCartesian, Point, Tangent, OrthogonalLine, and Angle. Suitable for high school calculus education and learning.
GeoGebra Commands & Parameters
CurveCartesian((t, f(t)), t, -4, 3) → APoint(A) → tTangent(t, A) → TangentOrthogonalLine(t, Tangent) → NormalAngle(Normal, Tangent) → α