
Visualization of Real Number Sets
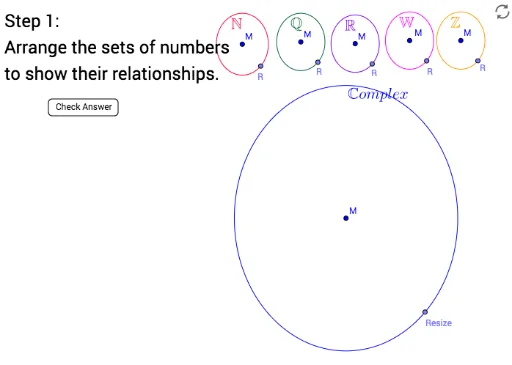
Loading the math board and drawing, please wait…
This example demonstrates the geometric representation and classification of real number sets through dynamic graphics. Key math concepts include real number classification (rational, irrational), set operations, and number line representation. Construction highlights involve using commands like Point, Circle, Polygon to create geometric objects for different number sets (e.g., N_c for natural numbers). Suitable for high school mathematics teaching to intuitively understand the structure and properties of the real number system.
GeoGebra Commands & Parameters
Point(Line[N_c, y = (-x)]) → N_rCircle(N_c, N_r) → NPoint(Line[W_c, y = (-x)]) → W_rCircle(W_c, W_r) → WPoint(Line[Z_c, y = (-x)]) → Z_rCircle(Z_c, Z_r) → ZPoint(Line[Q_c, y = (-x)]) → Q_rCircle(Q_c, Q_r) → QPoint(Line[R_c, y = (-x)]) → R_rCircle(R_c, R_r) → RPoint(Line[C_c, y = (-x)]) → C_rCircle(C_c, C_r) → CCorner(5) → APolygon(Corner[1], Corner[2], Corner[3], Corner[4]) → blankout, a, b, c, d