
Visual Representation of Equivalent Fractions and Decimals
Loading the math board and drawing, please wait…
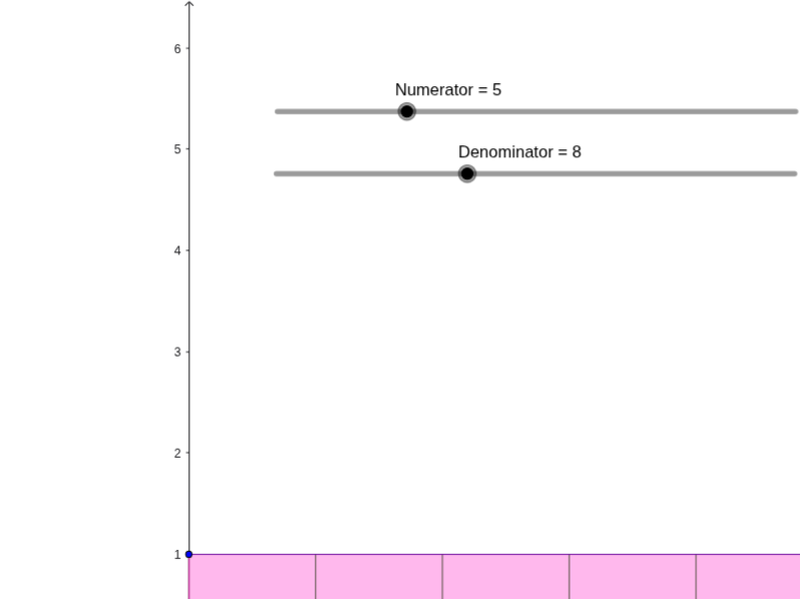
This example demonstrates the visual representation of equivalent fractions and decimals through geometric shapes. It involves concepts such as fraction equivalence, decimal conversion, and geometric visualization. The construction uses GeoGebra commands like Intersect, Polygon, and Sequence to create the figures. Suitable for middle school students to enhance understanding of fractions and geometry.
GeoGebra Commands & Parameters
Intersect(xAxis, yAxis) → APolygon(A, B, C, D) → poly1, a_1, b, c, dPolygon(B, G, E, A) → poly2, b_1, g, e, a_2Sequence(Segment[(i, 0), (i, 1)], i, 0, (Numerator * 10 / Denominator), 10 / Denominator) → list4Sequence(Segment[(i, 0), (i, 1)], i, 0, 10, 10 / Denominator) → list1
AI Drawing Prompt Reference
Draw a visual representation of equivalent fractions and decimals using geometric shapes. Include a rectangle and a circle connected by a line segment. The rectangle represents the fraction, and the circle represents the decimal. The line segment shows the equivalence. Make sure the drawing is clear and easy to understand for middle school students.
The prompt above was compiled from the original drawing commands and is for reference only.