
Visual Demo of Standard Deviation
Loading the math board and drawing, please wait…
In collections
Math Year 4 Unit Probability & Statistics
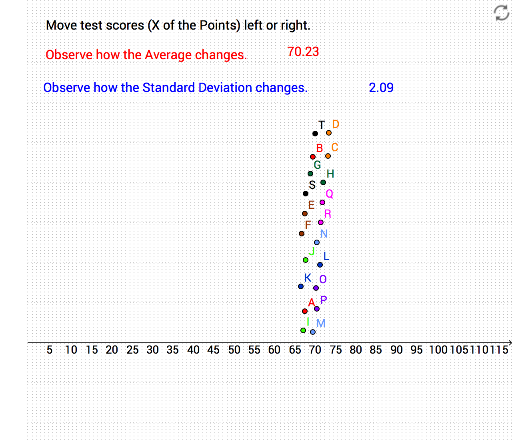
This example visually demonstrates the calculation and significance of standard deviation, intuitively showing data dispersion. Core math concepts include standard deviation, statistics, linear equations, bar charts, and pie charts. Construction highlights involve commands like SampleSDX, SDX, Text, and MeanX for sample creation, standard deviation calculation, text annotations, and mean display. Suitable for high school mathematics, introductory statistics, or data analysis beginners.
GeoGebra Commands & Parameters
SampleSDX(data) → SampleSDSDX(data) → SDText(SD) → text2MeanX(data) → AvgText(Avg) → text3
AI Drawing Prompt Reference
Draw a graph illustrating the concept of standard deviation. Include a bar chart showing data distribution and a scatter plot of data points. Add a text box for standard deviation calculation and a label for the mean. Ensure the graph is clear to show data dispersion.
The prompt above was compiled from the original drawing commands and is for reference only.