
Vertical Asymptotes
Loading the math board and drawing, please wait…
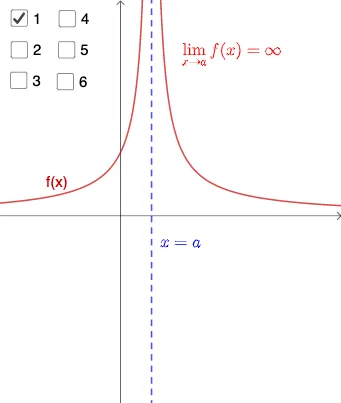
This example explores vertical asymptotes related to limits. By investigating the behavior of functions at specific points, the concept of vertical asymptotes is understood. Core mathematical concepts include functions and limits. Suitable for high school mathematics education and learning.
GeoGebra Commands & Parameters
f: y = abs(1 / (x - 1))x = 1Boolean a(true)g(x) = If[x > 1, f(x)]h(x) = If[x < 1, f(x)]Boolean b(false)Boolean c(false)j(x) = (-f(x))Boolean d(false)l(x) = If[x < 1, j]Boolean e(false)Boolean i(false)k(x) = If[x > 1, j(x)]
AI Drawing Prompt Reference
Draw a coordinate plane. First, plot the graph of y = |1/(x-1)|, which has a vertical asymptote at x=1. Draw a dashed vertical line at x=1 to represent the asymptote. Then, emphasize the right branch (x>1) of this graph with a solid curve, and the left branch (x<1) with a different style or color. Next, plot the reflection of this graph across the x-axis, i.e., y = -|1/(x-1)|, also with a vertical asymptote at x=1, and emphasize its right and left branches similarly. The final figure shows both the original and reflected functions approaching the asymptote from both sides, illustrating limit behavior.
The prompt above was compiled from the original drawing commands and is for reference only.