
Vertex Form Parabola: Max and Min Dynamic Demo
Loading the math board and drawing, please wait…
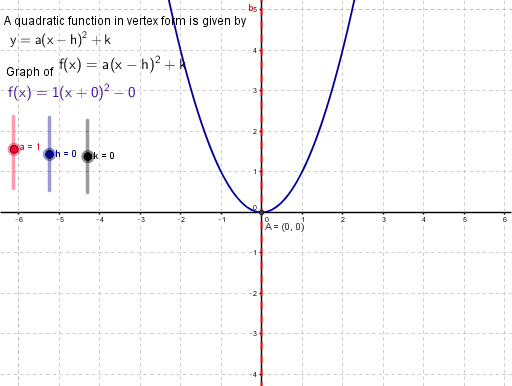
This GeoGebra example dynamically demonstrates the vertex form of a quadratic function y = a(x-h)² + k, showing how parameters a, h, and k affect the parabola's shape, position, and its maximum or minimum value. The core mathematical concepts include the vertex form, axis of symmetry, direction of opening, and determination of extrema (maximum/minimum). Construction highlights: the Intersect command is used to find intersection points, while sliders or text objects (a, h, k, f, text1-text5, A, b) control parameters and display results, updating the graph and values in real time. Suitable for middle and high school mathematics teaching, this example helps students understand transformations of quadratic graphs and extremum problems, and can be used for classroom exploration or self-directed learning.
GeoGebra Commands & Parameters
Intersect(f, b) → A
AI Drawing Prompt Reference
Draw a parabola in vertex form to show how parameters a, h, and k affect its shape, position, and maximum or minimum value. Use sliders to control these parameters and update the graph and values in real time. Find intersection points with a specific line using an intersect tool and display key results like the vertex, axis of symmetry, and extrema with text objects.
The prompt above was compiled from the original drawing commands and is for reference only.