
Venn Diagrams Interactive: Set Relations and Probability Visualization
Loading the math board and drawing, please wait…
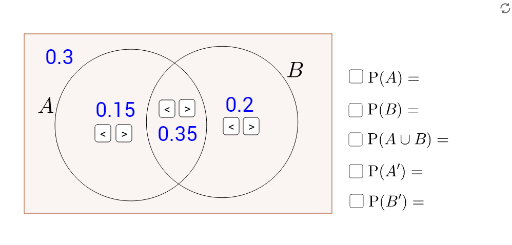
① This GeoGebra example demonstrates Venn diagrams interactively, visually representing set operations such as intersection, union, and complement, and supporting probability calculations. ② Core mathematical concepts include set operations, probability, ratios, and random variables, with overlapping or separated regions expressing relationships between events. ③ Construction highlights: uses Circle and Polygon commands to create circular regions and auxiliary polygons; objects include points A, B, C, D, circles c and d, multiple buttons (button1 to button6) for interactive control, text objects (text1 to text10) for labels and explanations, plus segments and polygons, forming a dynamic manipulable environment. ④ Suitable for middle and high school probability and statistics teaching, introductory set theory, and for teachers creating interactive lessons or students exploring set relationships and probability calculations.
GeoGebra Commands & Parameters
Circle(A, B) → cCircle(C, D) → dPolygon(G, E, F, H) → poly1, g, e_1, f, h
AI Drawing Prompt Reference
Create an interactive Venn diagram with two overlapping circles representing two events. The circles should be adjustable in size and position, with the overlapping area indicating intersection. Add a surrounding rectangle or quadrilateral as the universal set background, dividing the space into distinct regions. Include multiple buttons to toggle display of union, intersection, and complement operations, along with text labels explaining each region and showing probability values. The layout should be clear for teaching, allowing dynamic changes via sliders or dragging to update probabilities.
The prompt above was compiled from the original drawing commands and is for reference only.