
Circle and Square: Contain the Other Center?
Loading the math board and drawing, please wait…
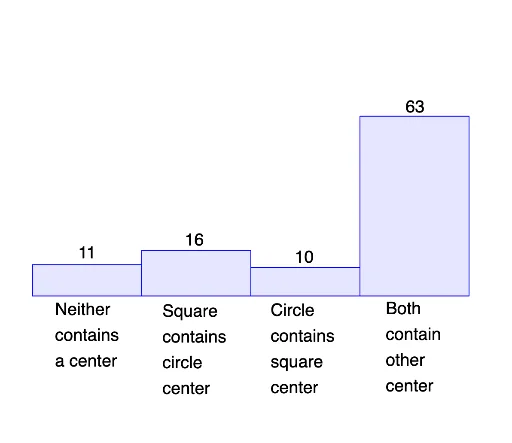
This GeoGebra example demonstrates a probabilistic geometry problem: given a circle and a square, what is the probability that the circle's center lies inside the square, and the square's center lies inside the circle? It uses random point generation to simulate the stochastic process, visualizing the outcomes with histograms and dynamic text. Core mathematical concepts include geometric containment, random processes, probability distributions (hypergeometric and geometric), and the use of quadratic functions and linear equations to define region boundaries. The construction employs GeoGebra commands such as Polygon, RandomPointIn, Circle, Center, Centroid, IsInRegion, and Histogram, with objects like poly1, points A–I, circle c, data, button1, and multiple text labels. This is suitable for high school and university students exploring geometric probability, Monte Carlo simulation, and the intersection of geometry and statistics. It serves as an interactive tool for teaching random sampling, conditional probability, and the visual comparison of theoretical vs. empirical results.
GeoGebra Commands & Parameters
Polygon((0, 0), (1, 0), 4) → poly1RandomPointIn(poly1) → ARandomPointIn(poly1) → BRandomPointIn(poly1) → CCircle(A, B, C) → cCenter(c) → DCentroid(poly1) → EIsInRegion(E, c) → EincIsInRegion(D, poly1) → DinpolyHistogram({-0.5, 0.5, 1.5, 2.5, 3.5}, data) → a
AI Drawing Prompt Reference
Draw a unit square with vertices on the coordinate axes. Randomly place three points inside the squareainer, and use these three points to define a circle. Mark the circle's center and the square's center. Highlight with distinct colors or markers whether the square's center lies inside the circle and whether the circle's center lies inside the square. Beside the geometry, add a histogram showing the counts of these two events over many random trials, to visualize the probability distribution. The layout should clearly relate the geometric construction to the statistical results.
The prompt above was compiled from the original drawing commands and is for reference only.