
Venn Diagrams for Set Theory
Loading the math board and drawing, please wait…
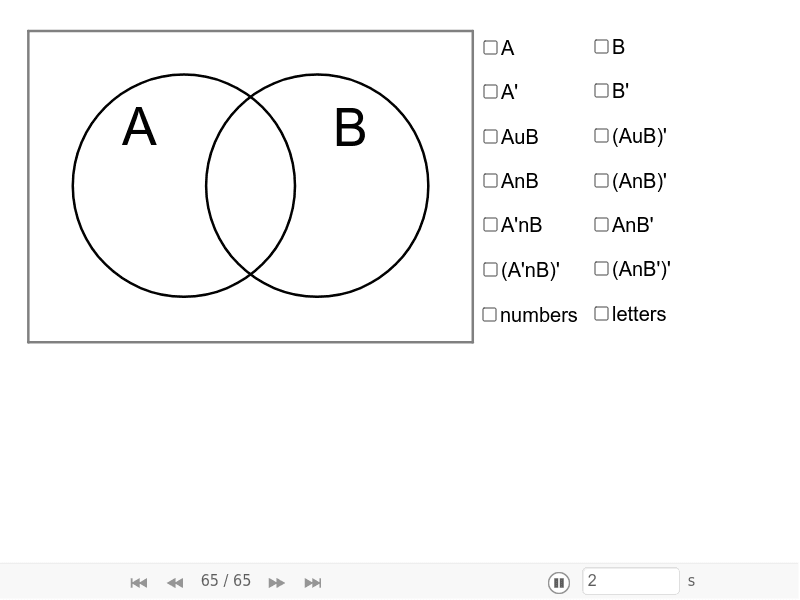
This example demonstrates Venn diagrams with movable letters and numbers to show the value of each set. It involves concepts like sets, intersections, unions, and basic probability. The construction uses GeoGebra commands such as Point, Circle, Polygon, Intersect, and CircleArc. Suitable for students learning set theory and probability statistics.
GeoGebra Commands & Parameters
Point(yAxis) → ACircle(A, 5) → AboldPoint(xAxis) → BCircle(B, 5) → BboldPolygon(C, D, E, F) → Ubold, c_1, d_1, e, fIntersect(Abold, Bbold, 1) → GIntersect(Abold, Bbold, 2) → HCircleArc(A, G, H) → AarcCircleArc(B, G, H) → AsarcCircleArc(A, H, G) → BsarcCircleArc(B, H, G) → BarcCircle(A, 5) → AshadeCircle(B, 5) → BshadePolygon(C, D, E, F) → Ushade, K_2, K_3, K_4, K_5Circle(A, 5) → AwhiteCircle(B, 5) → BwhiteCircleArc(B, G, H) → AsarcwhiteCircleArc(A, H, G) → BsarcwhiteCircleArc(A, H, G) → BsarcxCircleArc(B, G, H) → Asarcx
AI Drawing Prompt Reference
Draw two intersecting circles to represent sets A and B, with arcs inside each circle to indicate the intersection, unique part of A, and unique part of B. Use polygons to represent the intersection area and fill each circle with different colors to distinguish the sets.
The prompt above was compiled from the original drawing commands and is for reference only.