
Exploring Slopes of Perpendicular Lines by Isabel Lau
Loading the math board and drawing, please wait…
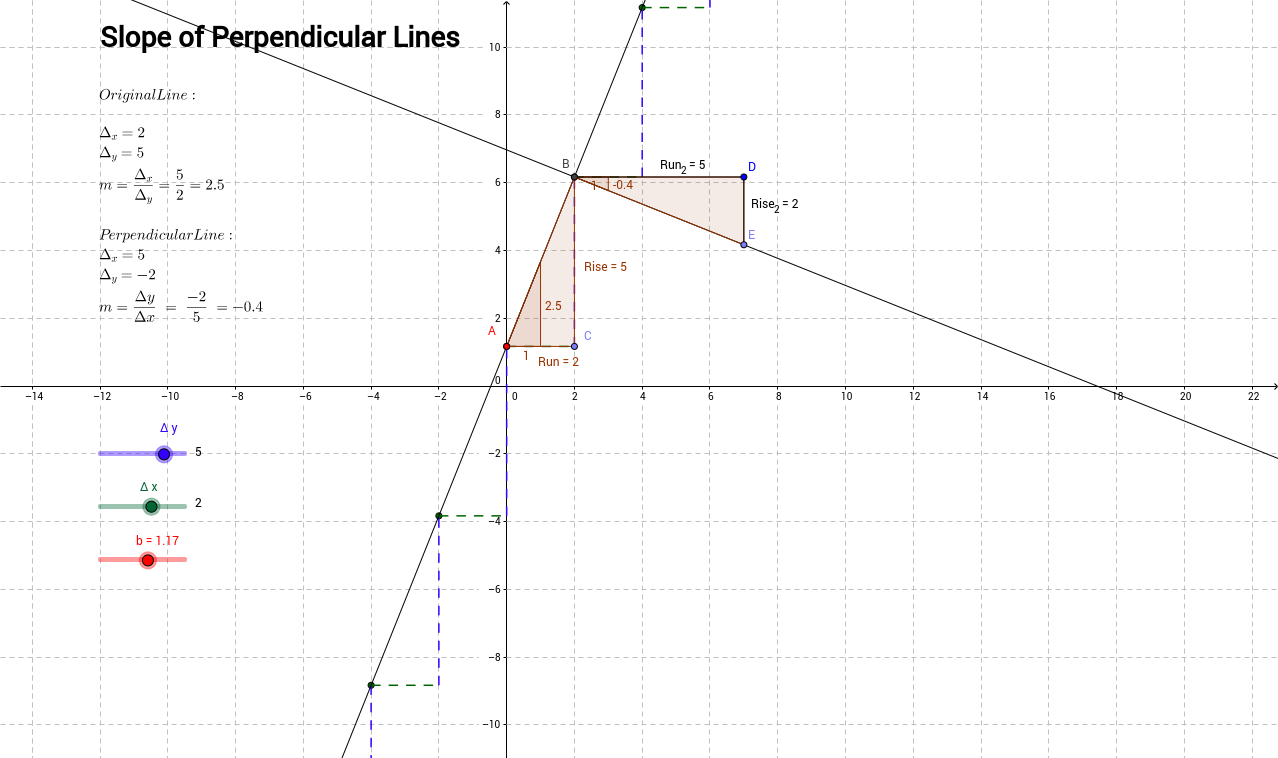
This example demonstrates how to dynamically explore the relationship between slopes of perpendicular lines. It involves core math concepts like slope calculation, perpendicularity, and coordinate geometry. Key GeoGebra commands and objects used include Line, Sequence, Point, Polygon, Slope, OrthogonalLine, Segment. Suitable for high school students or teachers for instructional demonstration and concept reinforcement.
GeoGebra Commands & Parameters
Line(A, B) → aSequence((deltax * i, b + deltay * i), i, -20, 20) → LSequence(Segment[A + (deltax * (i + 1), deltay * i), A + (deltax * (i + 1), deltay * (i + 1))], i, -10, 10) → list1Sequence(Segment[A + (deltax * i, deltay * i), A + (deltax * (i + 1), deltay * i)], i, -10, 10) → list2Point(list1) → CPolygon(A, B, C) → poly1, c, Rise, RunSlope(a) → m_1OrthogonalLine(B, a) → dSlope(d) → m_2Polygon(B, D, E) → poly2, e, b_1, d_1Segment(B, D) → Run_2Segment(D, E) → Rise_2
AI Drawing Prompt Reference
Draw two perpendicular lines, one through points A and B, and the other perpendicular to the first line passing through point B. Calculate and display the slope of the first line, then draw a triangle connecting points A, B, and C, where C lies on the first line. Next, draw another triangle perpendicular to the first line, connecting points B, D, and E, and display its slope.
The prompt above was compiled from the original drawing commands and is for reference only.