
Venn Diagrams and 2D Vectors Visualization
Loading the math board and drawing, please wait…
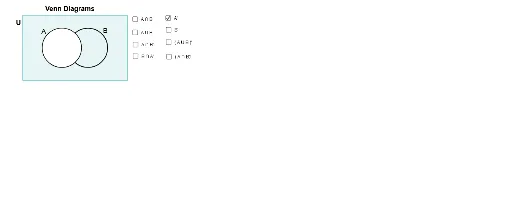
This example demonstrates the intersection and union of sets through Venn diagrams, combined with 2D vector spatial representation. Core math concepts include set theory, 2D vector operations, and analytical geometry. Construction highlights from the summary involve commands like Point, Circle, Intersect, and Polygon to build the graphics. Suitable for high school students and math enthusiasts to understand the relationship between sets and vectors in geometric space, aiding teaching and learning.
GeoGebra Commands & Parameters
Point(xAxis) → ECircle(E, 3) → ePoint(xAxis) → FCircle(F, 3) → fIntersect(e, f) → G, H, ,CircleArc(F, G, H) → gCircleArc(E, H, G) → hCircle(F, 3) → kCircle(E, 3) → pPoint(e) → APoint(f) → RCircumcircleArc(G, A, H) → sCircleArc(F, G, H) → tCircumcircleArc(G, R, H) → e_1CircleArc(E, H, G) → f_1Polygon(I, L, K, J) → poly4, i_1, l_1, k_1, j_1Circle(F, 2.95) → g_1Circle(E, 2.95) → h_1CircleArc(F, G, H) → q_1CircleArc(E, H, G) → r_1
AI Drawing Prompt Reference
Draw two intersecting circles to represent set intersection and union, connecting intersection points and circle centers with arcs. Include vectors inside the circles, marking start and end points, and form a closed region by connecting key points with a polygon. The overall graphic should illustrate the spatial relationship between set theory and 2D vectors, suitable for educational purposes.
The prompt above was compiled from the original drawing commands and is for reference only.