
Venn Diagram: Union and Intersection
Loading the math board and drawing, please wait…
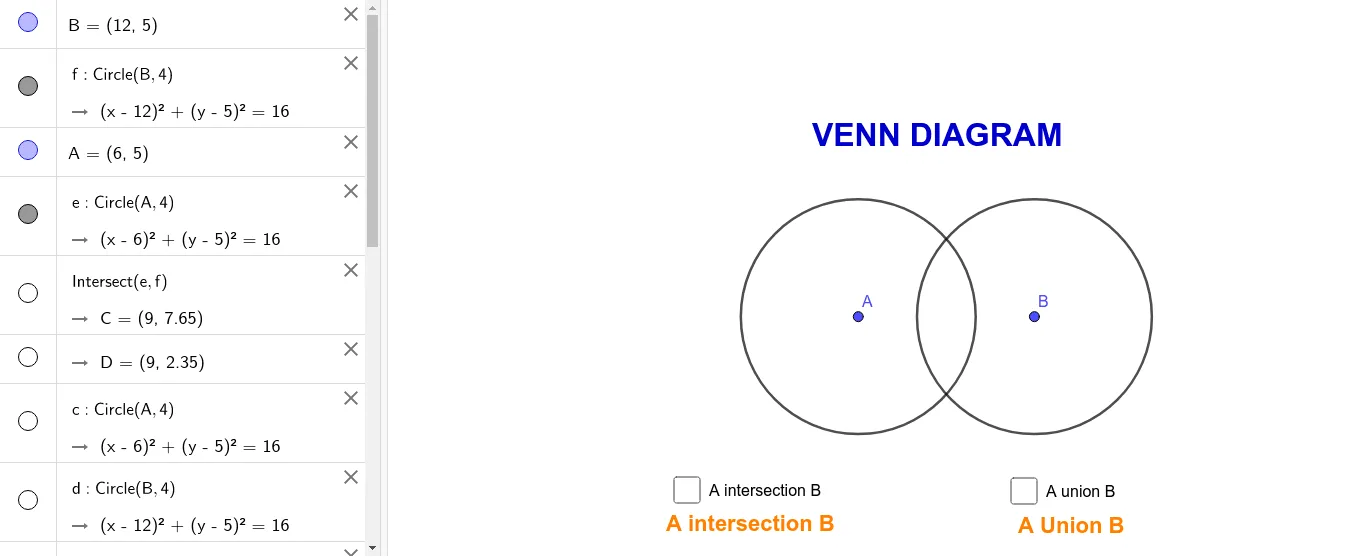
This GeoGebra example dynamically demonstrates the concepts of union and intersection in set theory using a Venn diagram. It visually represents how two sets combine (union) and share common elements (intersection). Core mathematical concepts include set operations, subset relationships, and foundational logic for probability. The construction employs GeoGebra commands such as Circle, Intersect, Point, and CircleArc, along with associated points and circle arcs. Suitable for middle and high school mathematics, it serves as an effective teaching tool for introducing set theory and basic logical operations.
GeoGebra Commands & Parameters
Circle(B, 4) → fCircle(A, 4) → eIntersect(e, f) → C, D, ,Circle(A, 4) → cCircle(B, 4) → dPoint(d) → EPoint(c) → FPoint(c) → GPoint(d) → HCircleArc(A, D, C) → gCircleArc(B, C, D) → h
AI Drawing Prompt Reference
Draw a Venn diagram illustrating the union and intersection of two sets. Start with two circles of equal radius that intersect, with their centers placed horizontally apart. The circles intersect at two points, one above and one below. Then, place a point on each circle, and another point on each circle, making four points total. Using the upper intersection point, the lower intersection point, and the centers of the circles, construct two circular arcs: one arc from the upper intersection point through the left circle's center to the lower intersection point, and another arc from the lower intersection point through the right circle's center to the upper intersection point. The final figure shows two overlapping circles with two arcs inside, dividing the area into regions representing the union and intersection of the sets.
The prompt above was compiled from the original drawing commands and is for reference only.